PNC Bank 2000 Annual Report Download - page 38
Download and view the complete annual report
Please find page 38 of the 2000 PNC Bank annual report below. You can navigate through the pages in the report by either clicking on the pages listed below, or by using the keyword search tool below to find specific information within the annual report.-
 1
1 -
2
-
3
-
4
-
5
-
6
-
7
-
8
-
9
-
10
-
11
-
12
-
13
-
14
-
15
-
16
-
17
-
18
-
19
-
20
-
21
-
22
-
23
-
24
-
25
-
26
-
27
-
 28
28 -
 29
29 -
 30
30 -
 31
31 -
 32
32 -
 33
33 -
 34
34 -
 35
35 -
 36
36 -
 37
37 -
 38
38 -
 39
39 -
 40
40 -
 41
41 -
 42
42 -
 43
43 -
 44
44 -
 45
45 -
 46
46 -
 47
47 -
 48
48 -
49
-
50
-
51
-
52
-
53
-
54
-
55
-
56
-
57
-
58
-
59
-
60
-
61
-
62
-
63
-
64
-
65
-
66
-
67
-
68
-
69
-
70
-
71
-
72
-
73
-
74
-
75
-
76
-
77
-
78
-
79
-
80
-
81
-
82
-
83
-
84
-
85
-
86
-
87
-
88
-
89
-
90
-
91
-
92
-
93
-
94
-
95
-
96
 |
 |

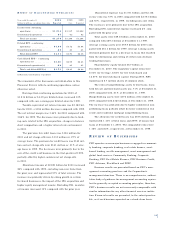
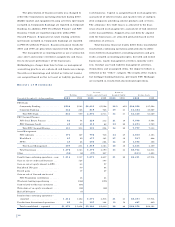
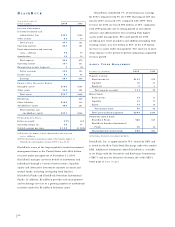
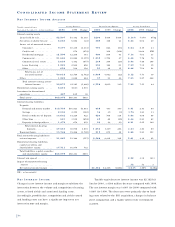
EF F E C T O F DI S C O N T I N U E D OP E R AT I O N S
Year ended December 31 2000 1999 1999
Dollars in millions, except per share data Reported Core Reported
Income from continuing
operations . . . . . . . . . . . . . . $1,214 $1,137 $1,202
Discontinued operations . . . . . . 65 62 62
Total net income . . . . . . . . . . $1,279 $1,199 $1,264
Diluted EPS – continuing
operations . . . . . . . . . . . . . . $4.09 $3.72 $3.94
Discontinued operations . . . . . . .22 .21 .21
Total diluted EPS . . . . . . . . . $4.31 $3.93 $4.15
Cash diluted EPS – continuing
operations (a) . . . . . . . . . . . . $4.48 $4.00 $4.21
Discontinued operations (a) . . . .22 .21 .21
Total cash diluted EPS (a) . . . $4.70 $4.21 $4.42
(a) Excludes amortization of goodwill
The remainder of the discussion and information in this
Financial Review reflects continuing operations, unless
otherwise noted.
Earnings from continuing operations for 2000 of
$1.214 billion or $4.09 per diluted share increased 10%
compared with core earnings per diluted share for 1999.
Taxable-equivalent net interest income was $2.182 bil-
lion for 2000, a $184 million decrease compared with 1999.
The net interest margin was 3.64% for 2000 compared with
3.86% for 1999. The decreases were primarily due to fund-
ing costs related to the ISG acquisition, changes in balance
sheet composition and a higher interest rate environment
in 2000.
The provision for credit losses was $136 million for
2000 and net charge-offs were $135 million or .27% of
average loans. The provision for credit losses was $163 mil-
lion and net charge-offs were $161 million or .31% of aver-
age loans in 1999. The decreases were primarily due to the
sale of the credit card business in the first quarter of 1999,
partially offset by higher commercial net charge-offs
in 2000.
N o n i n t e rest income of $2.891 billion for 2000 incre a s e d
28% compared with 1999, excluding non-core items fro m
the prior year, and re p resented 57% of total revenue. The
i n c rease was primarily driven by strong growth in cert a i n
fee-based businesses, the impact of the ISG acquisition and
higher equity management income. Excluding ISG, noninter-
est income increased 13% compared with the prior year.
Noninterest expense was $3.071 billion and the effi-
ciency ratio was 57% in 2000 compared with $2.703 billion
and 55%, respectively, in 1999, excluding non-core items.
The increases were primarily due to the ISG acquisition.
Excluding ISG, noninterest expense increased 2% com-
pared with the prior year.
Total assets were $69.8 billion at December 31, 2000
compared with $69.3 billion at December 31, 1999.
Average earning assets were $59.9 billion for 2000 com-
pared with $61.3 billion for 1999. Average earning assets
declined primarily due to a decrease in loans that resulted
from the downsizing and exiting of certain non-strategic
lending businesses.
Shareholders’ equity totaled $6.7 billion at
December 31, 2000. The regulatory capital ratios were
8.03% for leverage, 8.60% for tier I risk-based and
12.57% for total risk-based capital. During 2000, PNC
repurchased 6.7 million shares of common stock.
The ratio of nonperforming assets to total loans, loans
held for sale and foreclosed assets was .71% at December 31,
2000 compared with .61% at December 31, 1999.
Nonperforming assets were $372 million at December 31,
2000 compared with $325 million at December 31, 1999.
The increase was primarily due to higher commercial non-
performing loans partially offset by lower commercial real
estate and residential mortgage nonperforming loans.
The allowance for credit losses was $675 million and
represented 1.33% of total loans and 209% of nonaccrual
loans at December 31, 2000. The comparable ratios were
1.36% and 232% , respectively, at December 31, 1999.
RE V I E W O F BU S I N E S S E S
PNC operates seven major businesses engaged in communi-
ty banking, corporate banking, real estate finance, asset-
based lending, wealth management, asset management and
global fund services: Community Banking, Corporate
Banking, PNC Real Estate Finance, PNC Business Credit,
PNC Advisors, BlackRock and PFPC.
Business results are presented based on PNC’s man-
agement accounting practices and the Corporation’s
management structure. There is no comprehensive, authori-
tative body of guidance for management accounting equiva-
lent to generally accepted accounting principles; therefore,
PNC’s business results are not necessarily comparable with
similar information for any other financial services institu-
tion. Financial results are presented, to the extent practica-
ble, as if each business operated on a stand-alone basis.
35