PNC Bank 2000 Annual Report Download - page 80
Download and view the complete annual report
Please find page 80 of the 2000 PNC Bank annual report below. You can navigate through the pages in the report by either clicking on the pages listed below, or by using the keyword search tool below to find specific information within the annual report.-
 1
1 -
2
-
3
-
4
-
5
-
6
-
7
-
8
-
9
-
10
-
11
-
12
-
13
-
14
-
15
-
16
-
17
-
18
-
19
-
20
-
21
-
22
-
23
-
24
-
25
-
26
-
27
-
28
-
29
-
30
-
31
-
32
-
33
-
34
-
35
-
36
-
37
-
38
-
39
-
40
-
41
-
42
-
43
-
44
-
45
-
46
-
47
-
48
-
49
-
50
-
51
-
52
-
53
-
54
-
55
-
56
-
57
-
58
-
59
-
60
-
61
-
62
-
63
-
64
-
65
-
66
-
67
-
68
-
69
-
 70
70 -
 71
71 -
 72
72 -
 73
73 -
 74
74 -
 75
75 -
 76
76 -
 77
77 -
 78
78 -
 79
79 -
 80
80 -
 81
81 -
 82
82 -
 83
83 -
 84
84 -
 85
85 -
 86
86 -
 87
87 -
 88
88 -
 89
89 -
 90
90 -
91
-
92
-
93
-
94
-
95
-
96
 |
 |

77
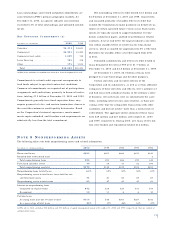
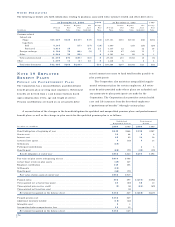
The accrued pension benefit liability above includes
$34 million and $46 million for the nonqualified plans at
December 31, 2000 and 1999, respectively. The accumulat-
ed benefit obligation for these plans was $53 million and
$68 million at December 31, 2000 and 1999, respectively.
Plan assets primarily consist of listed common stocks,
U.S. government and agency securities and collective funds.
Plan assets are managed by BlackRock and do not include
common stock of the Corporation.
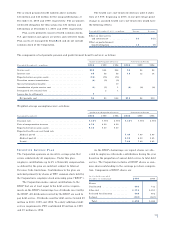
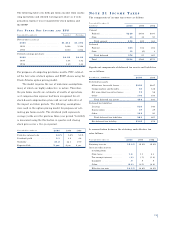
The health care cost trend rate declines until it stabi-
lizes at 5.00% beginning in 2005. A one-percentage-point
change in assumed health care cost trend rates would have
the following effects:
Year ended December 31, 2000 - in millions Increase Decrease
Effect on total service
and interest cost . . . . . . . . . . . . . . $1 $(1)
Effect on postretirement
benefit obligation . . . . . . . . . . . . . . 10 (9)
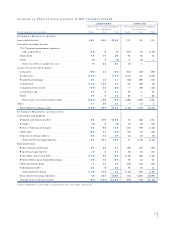
The components of net periodic pension and postretirement benefit cost were as follows:
Qualified and Nonqualified Pensions Postretirement Benefits
Year ended December 31 - in millions 2000 1999 1998 200 0 1999 1998
Service cost . . . . . . . . . . . . . . . . . . . . . . . . . . . . . . . . . . . . . . . $32 $24 $28 $2 $2 $2
Interest cost . . . . . . . . . . . . . . . . . . . . . . . . . . . . . . . . . . . . . . 65 58 58 14 12 14
Expected return on plan assets . . . . . . . . . . . . . . . . . . . . . . . . . (93) (75) (71)
Transition amount amortization . . . . . . . . . . . . . . . . . . . . . . . . (4) (5) (5)
Special termination benefits . . . . . . . . . . . . . . . . . . . . . . . . . . . 10
Amortization of prior service cost . . . . . . . . . . . . . . . . . . . . . . . (1) (1) 1 (6) (6) (6)
Recognized net actuarial loss . . . . . . . . . . . . . . . . . . . . . . . . . . 2 1
Losses due to settlements . . . . . . . . . . . . . . . . . . . . . . . . . . . . . 7
Net periodic cost . . . . . . . . . . . . . . . . . . . . . . . . . . . . . . . . . $6 $3 $22 $10 $8 $10
Weighted-average assumptions were as follows:
Qualified and Nonqualified Pensions Postretirement Benefits
Year ended December 31 2000 1999 1998 2000 1999 1998
Discount rate . . . . . . . . . . . . . . . . . . . . . . . . . . . . . . . . . . . . . . 7.50% 7.75% 6.75% 7.50% 7.75% 6.75%
Rate of compensation increase . . . . . . . . . . . . . . . . . . . . . . . . 4.50 4.50 4.50
Expected return on plan assets . . . . . . . . . . . . . . . . . . . . . . . . . 9.50 9.50 9.50
Expected health care cost trend rate
Medical pre-65 . . . . . . . . . . . . . . . . . . . . . . . . . . . . . . . . . . 7.00 7.00 5.45
Medical post-65 . . . . . . . . . . . . . . . . . . . . . . . . . . . . . . . . . . 8.00 8.00 5.45
Dental . . . . . . . . . . . . . . . . . . . . . . . . . . . . . . . . . . . . . . . . . 7.00 7.00 5.25
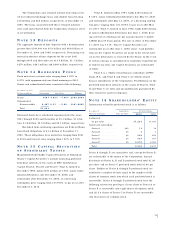
IN C E N T I V E SA V I N G S PL A N
The Corporation sponsors an incentive savings plan that
covers substantially all employees. Under this plan,
employee contributions up to 6% of biweekly compensation,
as defined by the plan are matched, subject to Internal
Revenue Code limitations. Contributions to the plan are
matched primarily by shares of PNC common stock held by
the Corporation’s employee stock ownership plan (“ESOP”).
The Corporation makes annual contributions to the
ESOP that are at least equal to the debt service require-
ments on the ESOP’s borrowings less dividends received by
the ESOP. All dividends received by the ESOP are used to
pay debt service. Dividends used for debt service totaled $9
million in 2000, 1999 and 1998. To satisfy additional debt
service requirements, PNC contributed $9 million in 1999
and $7 million in 1998.
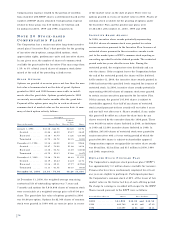
As the ESOP’s borrowings are repaid, shares are allo-
cated to employees who made contributions during the year
based on the proportion of annual debt service to total debt
service. The Corporation includes all ESOP shares as com-
mon shares outstanding in the earnings per share computa-
tion. Components of ESOP shares are:
As of or for the year ended
December 31 - in thousands 2000 1999
Shares
Unallocated . . . . . . . . . . . . . . . . . . 364 712
Allocated . . . . . . . . . . . . . . . . . . . . 4,316 4,251
Released for allocation . . . . . . . . . . 3 48 652
Retired . . . . . . . . . . . . . . . . . . . . . . (530) (587)
Total . . . . . . . . . . . . . . . . . . . . . . 4,498 5,028