PNC Bank 2000 Annual Report Download - page 66
Download and view the complete annual report
Please find page 66 of the 2000 PNC Bank annual report below. You can navigate through the pages in the report by either clicking on the pages listed below, or by using the keyword search tool below to find specific information within the annual report.-
 1
1 -
2
-
3
-
4
-
5
-
6
-
7
-
8
-
9
-
10
-
11
-
12
-
13
-
14
-
15
-
16
-
17
-
18
-
19
-
20
-
21
-
22
-
23
-
24
-
25
-
26
-
27
-
28
-
29
-
30
-
31
-
32
-
33
-
34
-
35
-
36
-
37
-
38
-
39
-
40
-
41
-
42
-
43
-
44
-
45
-
46
-
47
-
48
-
49
-
50
-
51
-
52
-
53
-
54
-
55
-
 56
56 -
 57
57 -
 58
58 -
 59
59 -
 60
60 -
 61
61 -
 62
62 -
 63
63 -
 64
64 -
 65
65 -
 66
66 -
 67
67 -
 68
68 -
 69
69 -
 70
70 -
 71
71 -
 72
72 -
 73
73 -
 74
74 -
 75
75 -
 76
76 -
77
-
78
-
79
-
80
-
81
-
82
-
83
-
84
-
85
-
86
-
87
-
88
-
89
-
90
-
91
-
92
-
93
-
94
-
95
-
96
 |
 |

63
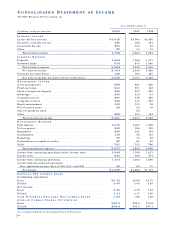
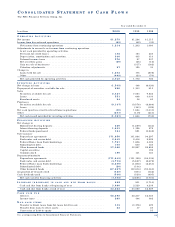
CO N S O L I D AT E D STAT E M E N T O F CA S H FL O W S
The PNC Financial Services Group, Inc.
In millions 2000 1999 1998
OP E R AT I N G AC T I V I T I E S
Net income . . . . . . . . . . . . . . . . . . . . . . . . . . . . . . . . . . . . . . . . . . . . . . . . $1,279 $1,264 $1,115
Income from discontinued operations . . . . . . . . . . . . . . . . . . . . . . . . . . . . . (65) (62) (35)
Net income from continuing operations . . . . . . . . . . . . . . . . . . . . . . . . . . 1,214 1,202 1,080
Adjustments to reconcile net income from continuing operations
to net cash provided by operating activities
Provision for credit losses . . . . . . . . . . . . . . . . . . . . . . . . . . . . . . . . . . . . 136 163 225
Depreciation, amortization and accretion . . . . . . . . . . . . . . . . . . . . . . . . . 340 305 310
Deferred income taxes . . . . . . . . . . . . . . . . . . . . . . . . . . . . . . . . . . . . . . . 376 97 207
Net securities gains . . . . . . . . . . . . . . . . . . . . . . . . . . . . . . . . . . . . . . . . . (29) (25) (16)
Gain on sale of businesses . . . . . . . . . . . . . . . . . . . . . . . . . . . . . . . . . . . (317) (162)
Valuation adjustments . . . . . . . . . . . . . . . . . . . . . . . . . . . . . . . . . . . . . . . 27 195 30
Change in
Loans held for sale . . . . . . . . . . . . . . . . . . . . . . . . . . . . . . . . . . . . . . . . . 1,652 175 (878)
Other . . . . . . . . . . . . . . . . . . . . . . . . . . . . . . . . . . . . . . . . . . . . . . . . . . . (668) (23) (70)
Net cash provided by operating activities . . . . . . . . . . . . . . . . . . . . . . . . . 3,048 1,772 726
IN V E S T I N G AC T I V I T I E S
Net change in loans . . . . . . . . . . . . . . . . . . . . . . . . . . . . . . . . . . . . . . . . . . (1,505) 348 (6,020)
Repayment of securities available for sale . . . . . . . . . . . . . . . . . . . . . . . . . . 920 1,303 813
Sales
Securities available for sale . . . . . . . . . . . . . . . . . . . . . . . . . . . . . . . . . . . 8,427 7,553 9,646
Loans . . . . . . . . . . . . . . . . . . . . . . . . . . . . . . . . . . . . . . . . . . . . . . . . . . . 551 648 3,030
Foreclosed assets . . . . . . . . . . . . . . . . . . . . . . . . . . . . . . . . . . . . . . . . . . 24 36 63
Purchases
Securities available for sale . . . . . . . . . . . . . . . . . . . . . . . . . . . . . . . . . . . (9,147) (9,576) (6,864)
Loans . . . . . . . . . . . . . . . . . . . . . . . . . . . . . . . . . . . . . . . . . . . . . . . . . . . (363) (129)
Net cash (paid) received for divestitures/acquisitions . . . . . . . . . . . . . . . . . (30) 1,854 (1,031)
Other . . . . . . . . . . . . . . . . . . . . . . . . . . . . . . . . . . . . . . . . . . . . . . . . . . . . (301) (139) (241)
Net cash (used) provided by investing activities . . . . . . . . . . . . . . . . . . . . (1,061) 1,664 (733)
FI N A N C I N G AC T I V I T I E S
Net change in
Noninterest-bearing deposits . . . . . . . . . . . . . . . . . . . . . . . . . . . . . . . . . . 329 (1,289) (444)
Interest-bearing deposits . . . . . . . . . . . . . . . . . . . . . . . . . . . . . . . . . . . . . 1,533 1,328 272
Federal funds purchased . . . . . . . . . . . . . . . . . . . . . . . . . . . . . . . . . . . . . 164 891 (3,242)
Sale/issuance
Repurchase agreements . . . . . . . . . . . . . . . . . . . . . . . . . . . . . . . . . . . . . 171,850 131,084 94,297
Bank notes and senior debt . . . . . . . . . . . . . . . . . . . . . . . . . . . . . . . . . . . 2,849 2,416 9,229
Federal Home Loan Bank borrowings . . . . . . . . . . . . . . . . . . . . . . . . . . . 1,781 1,696 4,326
Subordinated debt . . . . . . . . . . . . . . . . . . . . . . . . . . . . . . . . . . . . . . . . . . 100 650 140
Other borrowed funds . . . . . . . . . . . . . . . . . . . . . . . . . . . . . . . . . . . . . . . 37,060 32,997 92,859
Capital securities . . . . . . . . . . . . . . . . . . . . . . . . . . . . . . . . . . . . . . . . . . 198
Common stock . . . . . . . . . . . . . . . . . . . . . . . . . . . . . . . . . . . . . . . . . . . . 189 141 123
Repayment/maturity
Repurchase agreements . . . . . . . . . . . . . . . . . . . . . . . . . . . . . . . . . . . . . (171,645) (131,129) (94,336)
Bank notes and senior debt . . . . . . . . . . . . . . . . . . . . . . . . . . . . . . . . . . . (3,715) (5,827) (8,672)
Federal Home Loan Bank borrowings . . . . . . . . . . . . . . . . . . . . . . . . . . . (3,539) (1,802) (2,253)
Subordinated debt . . . . . . . . . . . . . . . . . . . . . . . . . . . . . . . . . . . . . . . . . . (20) (104)
Other borrowed funds . . . . . . . . . . . . . . . . . . . . . . . . . . . . . . . . . . . . . . . (37,367) (32,614) (93,363)
Acquisition of treasury stock . . . . . . . . . . . . . . . . . . . . . . . . . . . . . . . . . . . (428) (803) (342)
Cash dividends paid . . . . . . . . . . . . . . . . . . . . . . . . . . . . . . . . . . . . . . . . . . (546) (520) (495)
Net cash used by financing activities . . . . . . . . . . . . . . . . . . . . . . . . . . . . (1,405) (2,885) (1,703)
IN C R E A S E (D E C R E A S E ) I N C A S H A N D D U E F R O M B A N K S . . . . . 582 551 (1,710)
Cash and due from banks at beginning of year . . . . . . . . . . . . . . . . . . . . . 3,080 2,529 4,239
Cash and due from banks at end of year . . . . . . . . . . . . . . . . . . . . . . . . . $3,662 $3,080 $2,529
CA S H P A I D F O R
Interest . . . . . . . . . . . . . . . . . . . . . . . . . . . . . . . . . . . . . . . . . . . . . . . . . . $2,598 $2,237 $2,540
Income taxes . . . . . . . . . . . . . . . . . . . . . . . . . . . . . . . . . . . . . . . . . . . . . 289 344 362
NO N -C A S H I T E M S
Transfer to (from) loans from (to) loans held for sale . . . . . . . . . . . . . . . . . 143 (3,378) 429
Transfer from loans to other assets . . . . . . . . . . . . . . . . . . . . . . . . . . . . . . 23 37 40
Conversion of debt to equity . . . . . . . . . . . . . . . . . . . . . . . . . . . . . . . . . . 55
See accompanying Notes to Consolidated Financial Statements.
Year ended December 31