PNC Bank 2000 Annual Report Download - page 88
Download and view the complete annual report
Please find page 88 of the 2000 PNC Bank annual report below. You can navigate through the pages in the report by either clicking on the pages listed below, or by using the keyword search tool below to find specific information within the annual report.-
 1
1 -
2
-
3
-
4
-
5
-
6
-
7
-
8
-
9
-
10
-
11
-
12
-
13
-
14
-
15
-
16
-
17
-
18
-
19
-
20
-
21
-
22
-
23
-
24
-
25
-
26
-
27
-
28
-
29
-
30
-
31
-
32
-
33
-
34
-
35
-
36
-
37
-
38
-
39
-
40
-
41
-
42
-
43
-
44
-
45
-
46
-
47
-
48
-
49
-
50
-
51
-
52
-
53
-
54
-
55
-
56
-
57
-
58
-
59
-
60
-
61
-
62
-
63
-
64
-
65
-
66
-
67
-
68
-
69
-
70
-
71
-
72
-
73
-
74
-
75
-
76
-
77
-
 78
78 -
 79
79 -
 80
80 -
 81
81 -
 82
82 -
 83
83 -
 84
84 -
 85
85 -
 86
86 -
 87
87 -
 88
88 -
 89
89 -
 90
90 -
 91
91 -
 92
92 -
 93
93 -
 94
94 -
 95
95 -
 96
96
 |
 |

85
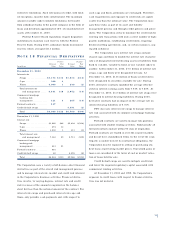
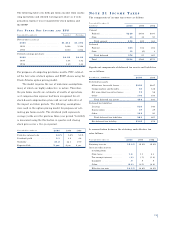
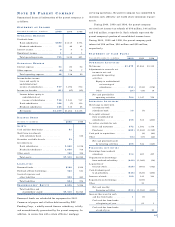
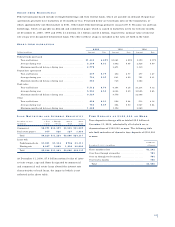
NO T E 2 8 PA R E N T CO M PA N Y
Summarized financial information of the parent company is
as follows:
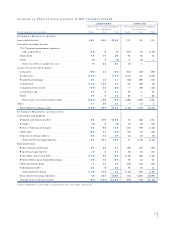
ST AT E M E N T O F IN C O M E
Year ended December 31 - in millions 2000 1999 1998
OP E R AT I N G RE V E N U E
Dividends from:
Bank subsidiaries . . . . . . . . . . $690 $1,139 $774
Nonbank subsidiaries . . . . . . . 55 80 21
Interest income . . . . . . . . . . . . . . 99 5
Noninterest income . . . . . . . . . . . 14 1
Total operating revenue . . . . . . 755 1,232 801
OP E R AT I N G EX P E N S E
Interest expense . . . . . . . . . . . . . 54 86 92
Other expense . . . . . . . . . . . . . . . (6) 52 7
Total operating expense . . . . . . 48 138 99
Income before income
taxes and equity in
undistributed net
income of subsidiaries . . . . . . . 707 1,094 702
Income tax benefits . . . . . . . . . . . (21) (47) (35)
Income before equity in
undistributed net
income of subsidiaries . . . . . 728 1,141 737
Bank subsidiaries . . . . . . . . . . 386 (7) 312
Nonbank subsidiaries . . . . . . . 165 130 66
Net income . . . . . . . . . . . . . . . $1,279 $1,264 $1,115
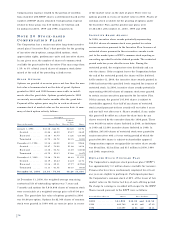
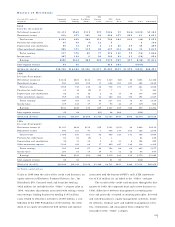
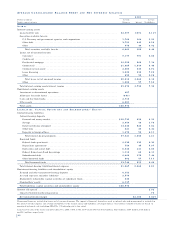
BA L A N C E SH E E T
December 31 - in millions 2000 1999
AS S E T S
Cash and due from banks . . . . . . . . . . . . $1
Short-term investments
with subsidiary bank . . . . . . . . . . . . . . $16
Securities available for sale . . . . . . . . . . . 53
Investments in:
Bank subsidiaries . . . . . . . . . . . . . . . . 5,640 6,016
Nonbank subsidiaries . . . . . . . . . . . . . 1,656 734
Other assets . . . . . . . . . . . . . . . . . . . . . . 160 154
Total assets . . . . . . . . . . . . . . . . . . . . . $7,510 $6,920
LI A B I L I T I E S
Borrowed funds . . . . . . . . . . . . . . . . . . . . $100 $100
Nonbank affiliate borrowings . . . . . . . . . . 522 613
Accrued expenses and
other liabilities . . . . . . . . . . . . . . . . . . 232 261
Total liabilities . . . . . . . . . . . . . . . . . . 854 974
SH A R E H O L D E R S ’ E Q U I T Y . . . . . . . 6,656 5,946
Total liabilities and
shareholders’ equity . . . . . . . . . . . . $7,510 $6,920
Borrowed funds are scheduled for repayment in 2001.
Commercial paper and all other debt issued by PNC
Funding Corp., a wholly-owned finance subsidiary, is fully
and unconditionally guaranteed by the parent company. In
addition, in connection with certain affiliates’ mortgage
servicing operations, the parent company has committed to
maintain such affiliates’ net worth above minimum require-
ments.
During 2000, 1999 and 1998, the parent company
received net income tax refunds of $36 million, $44 million
and $42 million, respectively. Such refunds represent the
parent company’s portion of consolidated income taxes.
During 2000, 1999 and 1998, the parent company paid
interest of $56 million, $96 million and $95 million,
respectively.
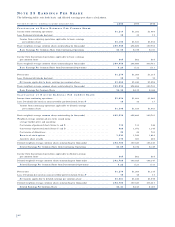
ST AT E M E N T O F CA S H FL O W S
Year ended December 31 - in millions 2000 1999 1998
OP E R AT I N G AC T I V I T I E S
Net income . . . . . . . . . . . . . . . . . $1,279 $1,264 $1,115
Adjustments to reconcile net
income to net cash
provided by operating
activities:
Equity in undistributed
net earnings of
subsidiaries . . . . . . . . . (551) (123) (378)
Other . . . . . . . . . . . . . . . . (24) (14) 19
Net cash provided by
operating activities . . . . . . 704 1,127 756
IN V E S T I N G AC T I V I T I E S
Net change in short-term
investments with
subsidiary bank . . . . . . . . . . . 16 (7)
Net capital returned
from (contributed to)
subsidiaries . . . . . . . . . . . . . . 258 631 (261)
Securities available for sale
Sales and maturities . . . . . . . . 372 1,592 1,170
Purchases . . . . . . . . . . . . . . . (425) (1,565) (1,129)
Cash paid in acquisitions . . . . . . . (2) (83)
Other . . . . . . . . . . . . . . . . . . . . (13) (17) (22)
Net cash provided (used)
by investing activities . . . . 208 632 (325)
FI N A N C I N G AC T I V I T I E S
Borrowings from nonbank
subsidiary . . . . . . . . . . . . . . . 314 687 297
Repayments on borrowings
from nonbank subsidiary . . . . (440) (1,080) (14)
Acquisition of
treasury stock . . . . . . . . . . . . . (428) (803) (342)
Cash dividends paid
to shareholders . . . . . . . . . . . . (546) (520) (495)
Issuance of stock . . . . . . . . . . . . . 189 141 123
Repayments on borrowings . . . . . (200)
Other . . . . . . . . . . . . . . . . . . . . 15
Net cash used by
financing activities . . . . . . (911) (1,760) (431)
Increase (decrease) in cash
and due from banks . . . . . . . . 1(1)
Cash and due from banks
at beginning of year . . . . . . $1 1
Cash and due from banks
at end of year . . . . . . . . . . $1 $1