PNC Bank 2000 Annual Report Download - page 53
Download and view the complete annual report
Please find page 53 of the 2000 PNC Bank annual report below. You can navigate through the pages in the report by either clicking on the pages listed below, or by using the keyword search tool below to find specific information within the annual report.-
 1
1 -
2
-
3
-
4
-
5
-
6
-
7
-
8
-
9
-
10
-
11
-
12
-
13
-
14
-
15
-
16
-
17
-
18
-
19
-
20
-
21
-
22
-
23
-
24
-
25
-
26
-
27
-
28
-
29
-
30
-
31
-
32
-
33
-
34
-
35
-
36
-
37
-
38
-
39
-
40
-
41
-
42
-
 43
43 -
 44
44 -
 45
45 -
 46
46 -
 47
47 -
 48
48 -
 49
49 -
 50
50 -
 51
51 -
 52
52 -
 53
53 -
 54
54 -
 55
55 -
 56
56 -
 57
57 -
 58
58 -
 59
59 -
 60
60 -
 61
61 -
 62
62 -
 63
63 -
64
-
65
-
66
-
67
-
68
-
69
-
70
-
71
-
72
-
73
-
74
-
75
-
76
-
77
-
78
-
79
-
80
-
81
-
82
-
83
-
84
-
85
-
86
-
87
-
88
-
89
-
90
-
91
-
92
-
93
-
94
-
95
-
96
 |
 |

50
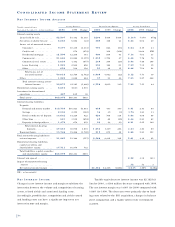
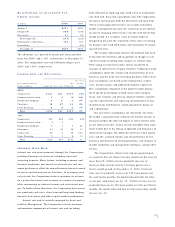
The amount of nonperforming loans that were current
as to principal and interest was $67 million at December
31, 2000 and $42 million at December 31, 1999. There
were no troubled debt restructured loans outstanding as of
either period end.
The increase in nonaccrual loans during 2000 was pri-
marily in specialized industry segments. A sustained or fur-
ther weakening of the economy, among other things, could
result in an increase in the number of delinquencies, bank-
ruptcies or defaults, which could result in a higher level of
nonperforming assets, net charge-offs and provision for
credit losses in future periods. See the Forward-Looking
Statements section of this Financial Review for additional
factors that could cause actual results to differ materially
from forward-looking statements or historical performance.
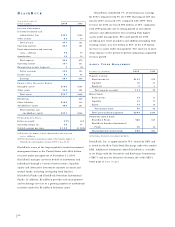
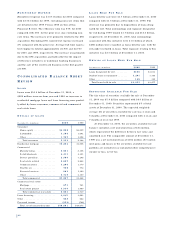
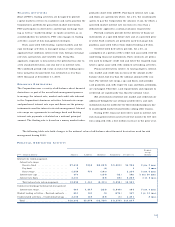
CH A N G E I N NO N P E R F O R M I N G AS S E T S
Year ended December 31
In millions 2000 1999
January 1 . . . . . . . . . . . . . . . . . . . . $325 $319
Transferred from accrual . . . . . . . . . 471 394
Returned to performing . . . . . . . . . . (13) (8)
Principal reductions . . . . . . . . . . . . (184) (265)
Sales . . . . . . . . . . . . . . . . . . . . . . . . (79) (31)
Charge-offs and other . . . . . . . . . . . (148) (84)
December 31 . . . . . . . . . . . . . . . $372 $325
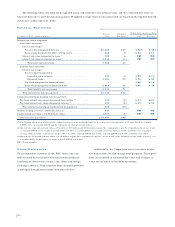
AC C R U I N G LO A N S PA S T DU E 9 0 D AY S O R MO R E
Year ended December 31
Amount Percent of Loans
December 31 – dollars in millions 2000 1999 2000 1999
Commercial . . . . . . . . . . . $46 $30 .22% .14%
Commercial real estate . . . 65.23 .18
Residential mortgage . . . . 36 24 .27 .19
Consumer . . . . . . . . . . . . 24 25 .26 .27
Lease financing . . . . . . . . 12.03 .07
Total . . . . . . . . . . . . . . $113 $86 .22 .17
Loans not included in nonaccrual or past due categories,
but where information about possible credit problems caus-
es management to be uncertain about the borrower’s ability
to comply with existing repayment terms over the next six
months totaled $182 million at December 31, 2000.
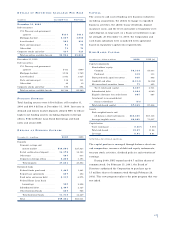
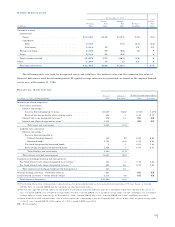
AL L O W A N C E FO R CR E D I T LO S S E S
In determining the adequacy of the allowance for credit
losses, the Corporation makes specific allocations to
impaired loans and to pools of watchlist and nonwatchlist
loans for various credit risk factors. Allocations to loan
pools are developed by business segment and risk rating
and are based on historical loss trends and management’s
judgment concerning those trends and other relevant fac-
tors. Those factors may include, among other things, actual
versus estimated losses, regional and national economic
conditions, business segment and portfolio concentrations,
industry competition and consolidation, and the impact of
government regulations. Consumer and residential mortgage
loan allocations are made at a total portfolio level based on
historical loss experience adjusted for portfolio activity and
economic conditions.
While PNC’s pool reserve methodologies strive to
reflect all risk factors, there continues to be a certain ele-
ment of risk associated with, but not limited to, potential
estimation or judgmental errors. Unallocated reserves are
designed to provide coverage for such risks. While alloca-
tions are made to specific loans and pools of loans, the total
reserve is available for all credit losses.
Senior management’s Reserve Adequacy Committee
provides oversight for the allowance evaluation process,
including quarterly evaluations and methodology and esti-
mation changes. The results of the evaluations are reported
to the Credit Committee of the Board of Directors.
The provision for credit losses for 2000 and the evalua-
tion of the allowance for credit losses as of December 31,
2000 reflected changes in loan portfolio composition and
changes in asset quality. The unallocated portion of the
allowance for credit losses represented 20% of the total
allowance and .26% of total loans at December 31,
2000 compared with 20% and .27%, respectively, at
December 31, 1999.