PNC Bank 2000 Annual Report Download - page 37
Download and view the complete annual report
Please find page 37 of the 2000 PNC Bank annual report below. You can navigate through the pages in the report by either clicking on the pages listed below, or by using the keyword search tool below to find specific information within the annual report.-
 1
1 -
2
-
3
-
4
-
5
-
6
-
7
-
8
-
9
-
10
-
11
-
12
-
13
-
14
-
15
-
16
-
17
-
18
-
19
-
20
-
21
-
22
-
23
-
24
-
25
-
26
-
 27
27 -
 28
28 -
 29
29 -
 30
30 -
 31
31 -
 32
32 -
 33
33 -
 34
34 -
 35
35 -
 36
36 -
 37
37 -
 38
38 -
 39
39 -
 40
40 -
 41
41 -
 42
42 -
 43
43 -
 44
44 -
 45
45 -
 46
46 -
 47
47 -
48
-
49
-
50
-
51
-
52
-
53
-
54
-
55
-
56
-
57
-
58
-
59
-
60
-
61
-
62
-
63
-
64
-
65
-
66
-
67
-
68
-
69
-
70
-
71
-
72
-
73
-
74
-
75
-
76
-
77
-
78
-
79
-
80
-
81
-
82
-
83
-
84
-
85
-
86
-
87
-
88
-
89
-
90
-
91
-
92
-
93
-
94
-
95
-
96
 |
 |

This Financial Review should be read in conjunction with
The PNC Financial Services Group, Inc. and subsidiaries’
(“Corporation” or “ PNC” ) Consolidated Financial State-
ments and Statistical Information included herein. For
information regarding business risks, see the Risk Manage-
ment and Risk Factors sections in this Financial Review.
Also, see the Forward-Looking Statements section in this
Financial Review for other factors that could cause actual
results to differ materially from forward-looking statements
or historical performance.
OV E RV I E W
TH E PNC FI N A N C I A L SE RV I C E S GR O U P, IN C .
The Corporation is one of the largest diversified financial
services companies in the United States, operating commu-
nity banking, corporate banking, real estate finance, asset-
based lending, wealth management, asset management and
global fund services businesses. The Corporation provides
certain products and services nationally and others in PNC’s
primary geographic markets in Pennsylvania, New Jersey,
Delaware, Ohio and Kentucky. The Corporation also pro-
vides certain products and services internationally.
Financial services organizations today are challenged
to demonstrate that they can generate sustainable and con-
sistent earnings growth in an increasingly competitive and
volatile environment. PNC has responded to these chal-
lenges by aggressively pursuing strategies designed to
achieve more consistent results. These strategies include
repositioning leverage-based businesses and improving the
earnings stream by building a diverse group of higher-
valuation businesses. Increasing contributions from growth
businesses, including asset management and processing and
the fee-based segments within PNC’s banking franchise, have
strengthened the Corporation’s revenue and earnings mix. In
addition, the Corporation seeks to enhance consolidated
value by leveraging technology, information, branding, mar-
keting and financial resources across all businesses.
As a result of these strategies, PNC’s financial charac-
teristics have changed significantly over the past five years.
N o n i n t e r est income grew 23% annualized during this time
period while net interest income decreased by appro x i m a t e l y
$300 million and total assets declined by $3.4 billion.
N o n i n t e rest income to total revenue increased from 36% in
1996 to 59% in 2000. The loan to deposit ratio impro v e d
f r om 113% to 106% as a result of exiting lower- r e t u r n lend-
ing businesses, while growing the deposit franchise. Over
this period, re t u rn on average common shareholders’ equity
i m p roved from 17% to 22% .
As part of this transition, the Corporation implemented
a number of initiatives designed to improve the risk/return
characteristics of its lending businesses. These included the
sale of the credit card business and exiting or downsizing
certain non-strategic lending businesses.
On October 2, 2000, PNC announced that it reached a
definitive agreement to sell its residential mortgage banking
business. The capital made available by the sale will be
redeployed in a number of ways, which may include repur-
chasing common stock, continuing to reduce balance sheet
leverage, reducing debt and making targeted investments in
higher-growth businesses. The amount of capital available
for redeployment and the income statement impact of the
sale will depend on fair market values and other factors,
and will not be determined until final settlement. The trans-
action closed on January 31, 2001.
PNC also expanded its fee-based services by acquiring
Investor Services Group (“ISG”) in December 1999. The
combination of ISG with PFPC, the Corporation’s global
fund services subsidiary, created one of the nation’s leading
full-service processors for pooled investment products.
Other strategic acquisitions during 2000 included
Automated Business Development Corp. (“ABD”), the lead-
ing provider of blue sky compliance services to the mutual
fund industry, Univest Financial Group LLC (“Univest” ), a
privately held provider of technology and data management
services to the commercial real estate finance industry, and
the origination and servicing business of U.B. Vehicle
Leasing Inc.
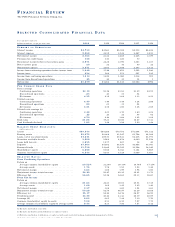
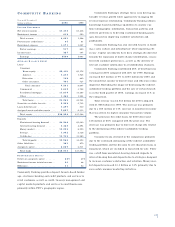
SU M M A R Y FI N A N C I A L RE S U LT S
Consolidated net income for 2000 was $1.279 billion or
$4.31 per diluted share, a 10% increase compared with
core earnings per diluted share for 1999. Return on average
common shareholders’ equity was 21.63% and return on
average assets was 1.68% for 2000 compared with core
returns of 21.24% and 1.60% , respectively, a year ago.
Cash earnings per diluted share, which exclude goodwill
amortization, were $4.70 for 2000, a 12% increase com-
pared with core cash earnings per diluted share a year ago.
Core earnings for the prior year exclude one-time gains that
were partially offset by the cost of certain strategic initia-
tives. Reported earnings for 1999 were $1.264 billion or
$4.15 per diluted share.
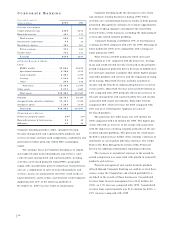
The residential mortgage banking business is reflected
in discontinued operations throughout the Corporation’s
consolidated financial statements. Accordingly, the earnings
and net assets of the residential mortgage banking business
are shown separately on one line in the income statement
and balance sheet, respectively, for all periods presented.
34