PNC Bank 2000 Annual Report Download - page 42
Download and view the complete annual report
Please find page 42 of the 2000 PNC Bank annual report below. You can navigate through the pages in the report by either clicking on the pages listed below, or by using the keyword search tool below to find specific information within the annual report.-
 1
1 -
2
-
3
-
4
-
5
-
6
-
7
-
8
-
9
-
10
-
11
-
12
-
13
-
14
-
15
-
16
-
17
-
18
-
19
-
20
-
21
-
22
-
23
-
24
-
25
-
26
-
27
-
28
-
29
-
30
-
31
-
 32
32 -
 33
33 -
 34
34 -
 35
35 -
 36
36 -
 37
37 -
 38
38 -
 39
39 -
 40
40 -
 41
41 -
 42
42 -
 43
43 -
 44
44 -
 45
45 -
 46
46 -
 47
47 -
 48
48 -
 49
49 -
 50
50 -
 51
51 -
 52
52 -
53
-
54
-
55
-
56
-
57
-
58
-
59
-
60
-
61
-
62
-
63
-
64
-
65
-
66
-
67
-
68
-
69
-
70
-
71
-
72
-
73
-
74
-
75
-
76
-
77
-
78
-
79
-
80
-
81
-
82
-
83
-
84
-
85
-
86
-
87
-
88
-
89
-
90
-
91
-
92
-
93
-
94
-
95
-
96
 |
 |

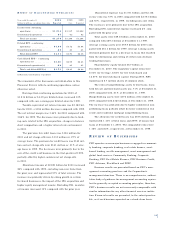
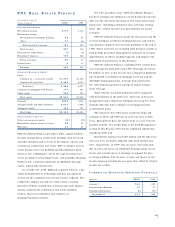
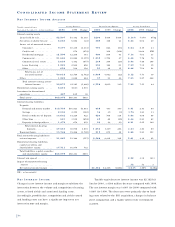
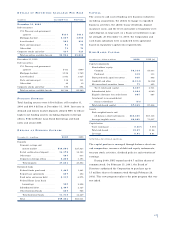
PN C RE A L ES T A T E FI N A N C E
Year ended December 31
Dollars in millions 2000 1999
IN C O M E ST A T E M E N T
Net interest income . . . . . . . . . . . . . . $115 $112
Noninterest income
Net commercial mortgage banking . 68 64
Other . . . . . . . . . . . . . . . . . . . . . . 37 36
Total noninterest income . . . . . . 105 100
Total revenue . . . . . . . . . . . . . . . . 220 212
Provision for credit losses . . . . . . . . . (7) (5)
Noninterest expense . . . . . . . . . . . . . 139 126
Pretax earnings . . . . . . . . . . . . . . . 88 91
Income taxes . . . . . . . . . . . . . . . . . . 617
Earnings . . . . . . . . . . . . . . . . . . . . $82 $74
AV E R A G E BA L A N C E SH E E T
Loans
Commercial – real estate related . . $1,970 $2,156
Commercial real estate . . . . . . . . . 2,424 2,515
Total loans . . . . . . . . . . . . . . . . 4,394 4,671
C o m m e rcial mortgages held for sale . . 174 1 2 4
Other assets . . . . . . . . . . . . . . . . . . . 938 759
Total assets . . . . . . . . . . . . . . . . . . $5,506 $5,554
Deposits . . . . . . . . . . . . . . . . . . . . . $288 $315
Assigned funds and other liabilities . . 4,834 4,848
Assigned capital . . . . . . . . . . . . . . . . 384 391
Total funds . . . . . . . . . . . . . . . . . . $5,506 $5,554
PE R F O R M A N C E RA T I O S
Return on assigned capital . . . . . . . . 21% 19%
Noninterest income to total revenue . . 48 47
Efficiency . . . . . . . . . . . . . . . . . . . . . 51 47
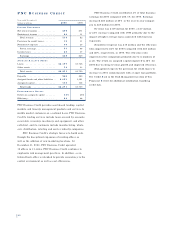
PNC Real Estate Finance provides credit, capital markets,
treasury management, commercial mortgage loan servicing
and other products and services to developers, owners and
investors in commercial real estate. PNC’s commercial real
estate financial services platform includes Midland Loan
Services, Inc. (“Midland”), one of the largest national ser-
vicers of commercial mortgage loans, and Columbia Housing
Partners, LP, a national syndicator of affordable housing
equity, among other businesses.
On October 27, 2000, Midland acquired Univest, a pri-
vately held provider of technology and data management
services to the commercial real estate finance industry. The
combined company created one of the nation’s leading
providers of Web-enabled loan servicing and asset admini-
stration solutions for commercial real estate portfolio
lenders, financial institutions and commercial
mortgage-backed securities.
Over the past three years, PNC Real Estate Finance
has been strategically shifting to a more balanced and valu-
able revenue stream by focusing on real estate processing
businesses, including commercial loan servicing. During
2000, 48% of total revenue was generated by fee-based
activities.
PNC Real Estate Finance made the decision to exit the
cyclical mortgage warehouse lending business and certain
non-strategic commercial real estate portfolios at the end of
1999. These activities are excluded from business results in
both periods presented. Management continues to evaluate
opportunities to reduce lending exposure and improve the
risk/return characteristics of this business.
PNC Real Estate Finance contributed 6% of total busi-
ness earnings for both 2000 and 1999. Earnings increased
$8 million or 11% in the year-to-year comparison primarily
due to growth in commercial mortgage servicing and the
affordable housing business. Average loans decreased
6% reflecting management’s strategy to reduce balance
sheet leverage.
Total revenue was $220 million for 2000 compared
with $212 million in the prior year. Increases in treasury
management and commercial mortgage servicing fees were
partially offset by lower commercial mortgage-backed
securitization gains.
The provision for credit losses positively impacted
earnings in 2000 and 1999 due to net recoveries in both
years. Management does not expect to be in a net recovery
position in 2001. See Credit Risk in the Risk Management
section of this Financial Review for additional information
regarding credit risk.
N o n i n t e rest expense was $139 million and the effic i e n c y
ratio was 51% for 2000 compared with $126 million and
47%, respectively, in 1999. The increases were primarily
due to non-cash losses on affordable housing equity invest-
ments and investments in technology to support the loan
servicing platform. The increase in non-cash losses on low
income housing investments was more than offset by related
income tax credits.
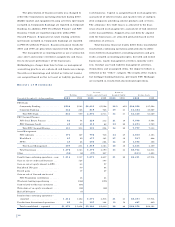
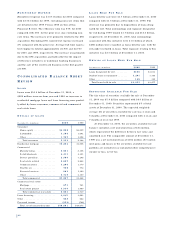
CO M M E R C I A L MO R T G A G E SE RV I C I N G PO R T F O L I O
Year ended December 31
In billions 2000 1999
January 1 . . . . . . . . . . . . . . . . . . . . $45 $39
Acquisitions/additions . . . . . . . . . . . 17 17
R e p a y m e n t s / t r a n s f e r s . . . . . . . . . . . . (8) (11)
December 31 . . . . . . . . . . . . . . . $54 $45
39