PNC Bank 2000 Annual Report Download - page 46
Download and view the complete annual report
Please find page 46 of the 2000 PNC Bank annual report below. You can navigate through the pages in the report by either clicking on the pages listed below, or by using the keyword search tool below to find specific information within the annual report.-
 1
1 -
2
-
3
-
4
-
5
-
6
-
7
-
8
-
9
-
10
-
11
-
12
-
13
-
14
-
15
-
16
-
17
-
18
-
19
-
20
-
21
-
22
-
23
-
24
-
25
-
26
-
27
-
28
-
29
-
30
-
31
-
32
-
33
-
34
-
35
-
 36
36 -
 37
37 -
 38
38 -
 39
39 -
 40
40 -
 41
41 -
 42
42 -
 43
43 -
 44
44 -
 45
45 -
 46
46 -
 47
47 -
 48
48 -
 49
49 -
 50
50 -
 51
51 -
 52
52 -
 53
53 -
 54
54 -
 55
55 -
 56
56 -
57
-
58
-
59
-
60
-
61
-
62
-
63
-
64
-
65
-
66
-
67
-
68
-
69
-
70
-
71
-
72
-
73
-
74
-
75
-
76
-
77
-
78
-
79
-
80
-
81
-
82
-
83
-
84
-
85
-
86
-
87
-
88
-
89
-
90
-
91
-
92
-
93
-
94
-
95
-
96
 |
 |

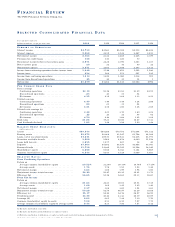
43
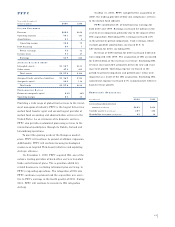
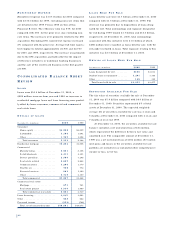
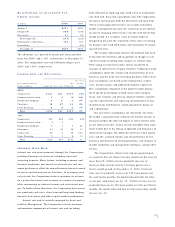
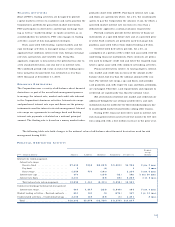
P F P C
Year ended December 31
Dollars in millions 2000 1999
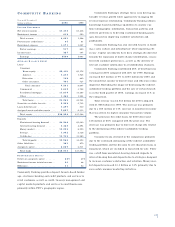
IN C O M E ST A T E M E N T
Revenue . . . . . . . . . . . . . . . . . . . . . $690 $264
Operating expense . . . . . . . . . . . . . 501 181
Amortization . . . . . . . . . . . . . . . . . . 31 4
Operating income . . . . . . . . . . . . 158 79
Debt financing . . . . . . . . . . . . . . . . 80 7
Pretax earnings . . . . . . . . . . . . . . 78 72
Income taxes . . . . . . . . . . . . . . . . . . 31 27
Earnings . . . . . . . . . . . . . . . . . . . $47 $45
AV E R A G E BA L A N C E SH E E T
Intangible assets . . . . . . . . . . . . . . . $1,107 $103
Other assets . . . . . . . . . . . . . . . . . . 471 205
Total assets . . . . . . . . . . . . . . . . . $1,578 $308
Assigned funds and other liabilities . $1,369 $196
Assigned capital . . . . . . . . . . . . . . . 209 112
Total funds . . . . . . . . . . . . . . . . . $1,578 $308
PE R F O R M A N C E RA T I O S
Return on assigned capital . . . . . . . 22% 40%
Operating margin . . . . . . . . . . . . . . 23 30
Providing a wide range of global fund services to the invest-
ment management industry, PFPC is the largest full-service
mutual fund transfer agent and second largest provider of
mutual fund accounting and administration services in the
United States. As an extension of its domestic services,
PFPC also provides customized processing services to the
international marketplace through its Dublin, Ireland and
Luxembourg operations.
To meet the growing needs of the European market-
place, PFPC will continue its pursuit of offshore expansion.
Additionally, PFPC will continue focusing technological
resources on targeted Web-based initiatives and exploring
strategic alliances.
On December 1, 1999, PFPC acquired ISG, one of the
nation’s leading providers of back-office services to mutual
funds and retirement plans. The acquisition added key
related businesses, including retirement plan servicing, to
PFPC’s expanding operations. The integration of ISG into
PFPC continues as planned and the acquisition was accre-
tive to PNC’s earnings in the fourth quarter of 2000. During
2001, PFPC will continue to execute its ISG integration
strategy.
On May 31, 2000, PFPC completed the acquisition of
ABD, the leading provider of blue sky compliance services
to the mutual fund industry.
PFPC contributed 4% of total business earnings for
both 2000 and 1999. Earnings increased $2 million in the
year-to-year comparison primarily due to the impact of the
ISG acquisition. Excluding ISG, earnings increased 21%
in the period-to-period comparison. Cash earnings, which
exclude goodwill amortization, increased 81% to
$87 million for 2000, including ISG.
Revenue of $690 million for 2000 increased $426 mil-
lion compared with 1999. The acquisition of ISG accounted
for $406 million of the increase in revenue. Excluding ISG,
revenue increased 22% primarily driven by new and exist-
ing client growth. Operating expense increased in the
period-to-period comparison and performance ratios were
impacted as a result of the ISG acquisition. Excluding ISG,
noninterest expense increased 21% commensurate with fee-
based revenue growth.
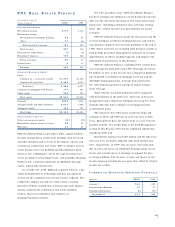
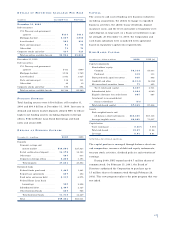
SE RV I C I N G ST AT I S T I C S
Year ended December 31
December 31 2000 1999
Accounting/administration
assets ($ in billions) . . . . . . . . . . . . . $463 $412
Custody assets ($ in billions) . . . . . . . . 437 388
Shareholder accounts (in millions) . . . . 43 34