PNC Bank 2000 Annual Report Download - page 59
Download and view the complete annual report
Please find page 59 of the 2000 PNC Bank annual report below. You can navigate through the pages in the report by either clicking on the pages listed below, or by using the keyword search tool below to find specific information within the annual report.-
 1
1 -
2
-
3
-
4
-
5
-
6
-
7
-
8
-
9
-
10
-
11
-
12
-
13
-
14
-
15
-
16
-
17
-
18
-
19
-
20
-
21
-
22
-
23
-
24
-
25
-
26
-
27
-
28
-
29
-
30
-
31
-
32
-
33
-
34
-
35
-
36
-
37
-
38
-
39
-
40
-
41
-
42
-
43
-
44
-
45
-
46
-
47
-
48
-
 49
49 -
 50
50 -
 51
51 -
 52
52 -
 53
53 -
 54
54 -
 55
55 -
 56
56 -
 57
57 -
 58
58 -
 59
59 -
 60
60 -
 61
61 -
 62
62 -
 63
63 -
 64
64 -
 65
65 -
 66
66 -
 67
67 -
 68
68 -
 69
69 -
70
-
71
-
72
-
73
-
74
-
75
-
76
-
77
-
78
-
79
-
80
-
81
-
82
-
83
-
84
-
85
-
86
-
87
-
88
-
89
-
90
-
91
-
92
-
93
-
94
-
95
-
96
 |
 |

19 9 9 V E R S U S 1 9 9 8
CO N S O L I D AT E D IN C O M E
ST A T E M E N T RE V I E W
OV E RV I E W
Earnings for 1999 were $1.202 billion or $3.94 per diluted
share and included one-time gains that were partially offset
by the cost of certain strategic initiatives. Cash earnings per
diluted share were $4.21 for 1999, a 14% increase com-
pared with 1998.
Core earnings, which exclude one-time gains and the
cost of certain strategic initiatives, were $1.137 billion or
$3.72 per diluted share, a 7% increase compared with
1998. On a core basis, return on average common share-
holders’ equity was 20.12% and return on average assets
was 1.66% compared with 20.14% and 1.55% , respectively,
in the prior year. Core cash earnings per diluted share were
$4.00 for 1999, an 8% increase compared with 1998.
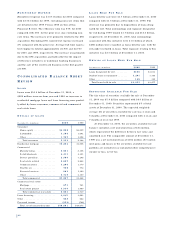
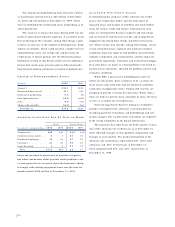
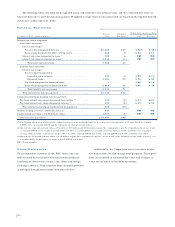
The following table summarizes one-time gains and the
cost of certain strategic initiatives and reconciles reported
to core earnings for 1999.
Year ended December 31
Year ended December 31, 1999 – in millions Pretax After-tax
Reported earnings . . . . . . . . . . . . . . . $1,788 $1,202
Gain on sale of credit card business (193) (125)
Gain on sale of equity interest in EPS (97) (63)
BlackRock IPO gain . . . . . . . . . . . (64) (59)
Branch gains . . . . . . . . . . . . . . . . . (27) (17)
Gain on sale of Concord stock,
net of PNC Foundation
contribution . . . . . . . . . . . . . . . . (11) (16)
Wholesale lending repositioning . . . 195 126
Costs related to efficiency initiatives 98 64
Write-down of an equity investment 28 18
Mall ATM buyout . . . . . . . . . . . . . . 12 7
Core earnings . . . . . . . . . . . . . . . . . . $1,729 $1,137
NE T IN T E R E S T IN C O M E
Taxable-equivalent net interest income was $2.366 billion
for 1999, a $148 million decrease compared with 1998. The
net interest margin was 3.86% for 1999 compared with
3.99% in the prior year. These declines were primarily due
to the sale of the credit card business in the first quarter of
1999. Excluding the credit card business, net interest
income for 1999 increased $107 million or 5% and the net
interest margin widened nine basis points compared with
the prior year. The increases were primarily due to higher
commercial and other loans that resulted from strong growth
in middle market lending and the strategic expansion of
secured and equipment lease financing.
PR O V I S I O N F O R CR E D I T LO S S E S
The provision for credit losses was $163 million in 1999
compared with $225 million in 1998. Net charge-offs were
$161 million or .31% of average loans for 1999 compared
with $447 million or .80% , respectively, in 1998. The
decreases were primarily due to the sale of the credit card
business in the first quarter of 1999. Excluding credit cards,
net charge-offs were .20% of average loans for 1999 com-
pared with .32% in 1998.
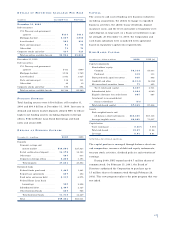
NO N I N T E R E S T IN C O M E
Noninterest income was $2.450 billion for 1999 and repre-
sented 51% of total revenue compared with $2.086 billion
and 45%, respectively, in 1998. The increases were prima-
rily due to strong growth in fee-based businesses.
Asset management fees of $681 million for 1999
increased $143 million or 26% compared with 1998,
excluding performance fees associated with BAI, a pooled
investment fund that was liquidated in 1999, and revenue
from the corporate trust business that was sold in 1998.
Assets under management increased to approximately $213
billion at December 31, 1999 compared with $174 billion at
December 31, 1998.
Mutual fund servicing fees of $251 million for 1999
increased $69 million or 38% compared with 1998 of which
$30 million was attributable to the one-month impact of
the ISG acquisition. The remaining increase was primarily
due to new and existing client growth as well as market
a p p re c i a t i o n .
Service charges on deposits of $207 million were con-
sistent with the prior year. Brokerage income of $219 mil-
lion in 1999 increased $128 million compared with 1998
primarily due to the acquisition of Hilliard Lyons.
Consumer services revenue of $218 million for 1999
d e c reased $67 million compared with 1998 primarily due
to the sale of the credit card business in the first quart e r
of 1999.
56