PNC Bank 2000 Annual Report Download - page 16
Download and view the complete annual report
Please find page 16 of the 2000 PNC Bank annual report below. You can navigate through the pages in the report by either clicking on the pages listed below, or by using the keyword search tool below to find specific information within the annual report.-
 1
1 -
2
-
3
-
4
-
5
-
 6
6 -
 7
7 -
 8
8 -
 9
9 -
 10
10 -
 11
11 -
 12
12 -
 13
13 -
 14
14 -
 15
15 -
 16
16 -
 17
17 -
 18
18 -
 19
19 -
 20
20 -
 21
21 -
 22
22 -
 23
23 -
 24
24 -
 25
25 -
 26
26 -
27
-
28
-
29
-
30
-
31
-
32
-
33
-
34
-
35
-
36
-
37
-
38
-
39
-
40
-
41
-
42
-
43
-
44
-
45
-
46
-
47
-
48
-
49
-
50
-
51
-
52
-
53
-
54
-
55
-
56
-
57
-
58
-
59
-
60
-
61
-
62
-
63
-
64
-
65
-
66
-
67
-
68
-
69
-
70
-
71
-
72
-
73
-
74
-
75
-
76
-
77
-
78
-
79
-
80
-
81
-
82
-
83
-
84
-
85
-
86
-
87
-
88
-
89
-
90
-
91
-
92
-
93
-
94
-
95
-
96
 |
 |

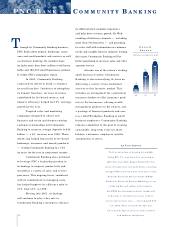
14
h r ough its Community Banking business,
PNC Bank offers deposit, brokerage, insur-
ance and credit products and services as well
as electronic banking. Its customer base
includes more than three million retail house-
holds and 180,000 small businesses, primari-
ly within PNC’s geographic re g i o n .
In 2000, Community Banking
continued its efforts to build a customer-
focused franchise. Initiatives to strengthen
its deposit franchise, increase revenues
contributed by fee-based sources, and
improve efficiency helped fuel 9% earnings
growth for the year.
Targeted sales and marketing
campaigns designed to attract new
business and retain and deepen existing
customer relationships led Community
Banking to increase average deposits to $36
billion — a 4% increase over 1999. These
e ff o rts also helped boost sales of fee-based
b r okerage, insurance and annuity pro d u c t s
— leading Community Banking to a 13%
i n c rease for the year in noninterest income.
Community Banking also continued
to leverage PNC’s leadership position in
technology to improve productivity and
streamline a variety of sales and service
processes. This ongoing focus, combined
with its commitment to managing costs,
has helped improve its efficiency ratio to
51% from 55% in 1998.
Moving into 2001, technology
will continue to play a key role in
Community Banking’s strategy to enhance
its diff e r entiated customer experience
and help drive revenue growth. By We b -
enabling all delivery channels — including
m o r e than 700 branches — and pro v i d i n g
its sales staff with information on customer
needs and insights from its industry - l e a d i n g
data mart, Community Banking will be
better positioned to increase sales and off e r
superior serv i c e .
Already one of the nation’s leading
small business lenders, Community
Banking is also intensifying its focus on
delivering a variety of non-traditional
services to this lucrative market. This
includes an arrangement for a prominent
insurance broker to offer insurance prod-
ucts to the businesses, offering wealth
management products to the owners, and
a package of financial products and serv-
ices called Workplace Banking to small
business employees. Community Banking
remains committed to the goal of creating
sustainable, long-term value for share-
holders, customers, employees and the
communities it serves.
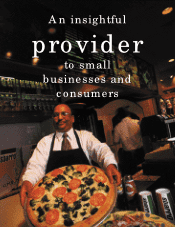
ATYOUR SERVICE
To focus more time on keeping his multiple
Camp Hill, Pa.-area franchises operating as
efficiently as possible, Raghu Tadavarthy does
much of his personal and small business banking
t h r ough PNC’s 24 hours a day, seven days a week
National Financial Services Center (NFSC).
Ranked by Financial Services Marketing as one
of the top five call centers in the industry,
the NFSC has leveraged customer insight and
technology to streamline processes, enhance
services and increase sales — which jumped 55%
over 1999. These achievements have also
led to double-digit increases in both customer
and employee satisfaction.
T
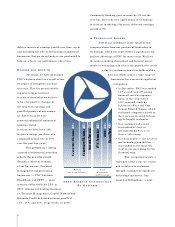
PNC BA N K
—
CO M M U N I T Y BA N K I N G
DE P O S I T
GR O W T H
( i n c r ease over previous year)
1%
98 99 00
2%
4%