PNC Bank 2000 Annual Report Download - page 73
Download and view the complete annual report
Please find page 73 of the 2000 PNC Bank annual report below. You can navigate through the pages in the report by either clicking on the pages listed below, or by using the keyword search tool below to find specific information within the annual report.-
 1
1 -
2
-
3
-
4
-
5
-
6
-
7
-
8
-
9
-
10
-
11
-
12
-
13
-
14
-
15
-
16
-
17
-
18
-
19
-
20
-
21
-
22
-
23
-
24
-
25
-
26
-
27
-
28
-
29
-
30
-
31
-
32
-
33
-
34
-
35
-
36
-
37
-
38
-
39
-
40
-
41
-
42
-
43
-
44
-
45
-
46
-
47
-
48
-
49
-
50
-
51
-
52
-
53
-
54
-
55
-
56
-
57
-
58
-
59
-
60
-
61
-
62
-
 63
63 -
 64
64 -
 65
65 -
 66
66 -
 67
67 -
 68
68 -
 69
69 -
 70
70 -
 71
71 -
 72
72 -
 73
73 -
 74
74 -
 75
75 -
 76
76 -
 77
77 -
 78
78 -
 79
79 -
 80
80 -
 81
81 -
 82
82 -
 83
83 -
84
-
85
-
86
-
87
-
88
-
89
-
90
-
91
-
92
-
93
-
94
-
95
-
96
 |
 |

70
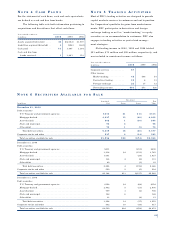
The expected weighted-average life of securities available
for sale was 4 years and 5 months at December 31, 2000
compared with 4 years and 7 months at year-end 1999 and
2 years and 8 months at year-end 1998.
At December 31, 2000, the securities available for sale
balance included a net unrealized loss of $54 million that
represented the difference between fair value and amortized
cost. The comparable amounts at December 31, 1999 and
1998 were net unrealized losses of $184 million and
$28 million, respectively. Net unrealized gains and losses in
the securities available for sale portfolio are included in
accumulated other comprehensive income or loss, net of tax.
Net securities gains, associated with the disposition of
securities available for sale, were $20 million in 2000,
$22 million in 1999 and $16 million in 1998. Reflected in
the 1999 net securities gains was a $41 million gain from
the sale of Concord EFS, Inc. ("Concord") stock that was
partially offset by a $28 million write-down of an equity
investment. Net securities gains of $9 million in 2000 and
$3 million in 1999 related to commercial mortgage banking
activities were included in corporate services revenue.
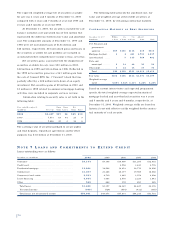
Information relating to security sales is set forth in the
following table:
Year ended December 31 Gross Gross Net
In millions Proceeds Gains Losses Gains Taxes
2000 . . . . . . . . . . . . . . $8,427 $37 $8 $29 $10
1999 . . . . . . . . . . . . . . . 7,573 69 44 25 9
1998 . . . . . . . . . . . . . . . 9,646 20 4 16 6
The carrying value of securities pledged to secure public
and trust deposits, repurchase agreements and for other
purposes was $3.8 billion at December 31, 2000.
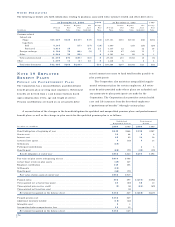
The following table presents the amortized cost, fair
value and weighted-average yield of debt securities at
December 31, 2000, by remaining contractual maturity.
CO N T R A C T U A L MAT U R I T Y O F DE B T SE C U R I T I E S
December 31, 2000 Within 1 to 5 to After 10
In millions 1 Year 5 Years 10 Years Years Total
U.S. Treasury and
government
agencies . . . . . .
$87 $101 $115 $10 $313
Mortgage-backed . .
3 2 241 3,791 4,037
Asset-backed . . . .
7 135 760 902
State and
municipal . . . . .
3 14 42 35 94
Other debt . . . . . . .
3 35 18 17 73
Total . . . . . . . . .
$96 $159 $551 $4,613 $5,419
Fair value . . . . . . .
$106 $156 $544 $4,571 $5,377
Weighted-average
yield . . . . . . . . .
5.88% 5.54% 6.41% 6.26% 6.25%
Based on current interest rates and expected prepayment
speeds, the total weighted-average expected maturity of
mortgage-backed and asset-backed securities was 4 years
and 5 months and 3 years and 9 months, respectively, at
December 31, 2000. Weighted-average yields are based on
historical cost with effective yields weighted for the contrac-
tual maturity of each security.
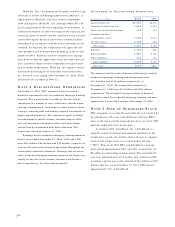
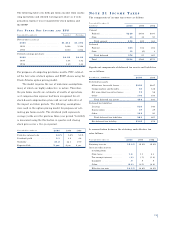
NO T E 7 LO A N S A N D CO M M I T M E N T S T O EX T E N D CR E D I T
Loans outstanding were as follows:
December 31 - in millions 2000 1999 1998 1997 1996
Consumer . . . . . . . . . . . . . . . . . . . . . . . . . . . . . . . . . $9,133 $9,348 $10,980 $11,205 $12,092
Credit card. . . . . . . . . . . . . . . . . . . . . . . . . . . . . . . . . 2,958 3,830 2,776
Residential mortgage . . . . . . . . . . . . . . . . . . . . . . . . . 13,264 12,506 12,253 12,776 12,696
Commercial . . . . . . . . . . . . . . . . . . . . . . . . . . . . . . . . 21,207 21,468 25,177 19,988 18,588
Commercial real estate. . . . . . . . . . . . . . . . . . . . . . . . 2,583 2,730 3,449 3,974 4,098
Lease financing . . . . . . . . . . . . . . . . . . . . . . . . . . . . . 4,845 3,663 2,978 2,224 1,641
Other . . . . . . . . . . . . . . . . . . . . . . . . . . . . . . . . . . 568 682 392 650 285
Total loans . . . . . . . . . . . . . . . . . . . . . . . . . . . . . . . 51,600 50,397 58,187 54,647 52,176
Unearned income . . . . . . . . . . . . . . . . . . . . . . . . . . (999) (724) (554) (412) (385)
Total loans, net of unearned income . . . . . . . . . . . . $50,601 $49,673 $57,633 $54,235 $51,791