PNC Bank 2000 Annual Report Download - page 55
Download and view the complete annual report
Please find page 55 of the 2000 PNC Bank annual report below. You can navigate through the pages in the report by either clicking on the pages listed below, or by using the keyword search tool below to find specific information within the annual report.-
 1
1 -
2
-
3
-
4
-
5
-
6
-
7
-
8
-
9
-
10
-
11
-
12
-
13
-
14
-
15
-
16
-
17
-
18
-
19
-
20
-
21
-
22
-
23
-
24
-
25
-
26
-
27
-
28
-
29
-
30
-
31
-
32
-
33
-
34
-
35
-
36
-
37
-
38
-
39
-
40
-
41
-
42
-
43
-
44
-
 45
45 -
 46
46 -
 47
47 -
 48
48 -
 49
49 -
 50
50 -
 51
51 -
 52
52 -
 53
53 -
 54
54 -
 55
55 -
 56
56 -
 57
57 -
 58
58 -
 59
59 -
 60
60 -
 61
61 -
 62
62 -
 63
63 -
 64
64 -
 65
65 -
66
-
67
-
68
-
69
-
70
-
71
-
72
-
73
-
74
-
75
-
76
-
77
-
78
-
79
-
80
-
81
-
82
-
83
-
84
-
85
-
86
-
87
-
88
-
89
-
90
-
91
-
92
-
93
-
94
-
95
-
96
 |
 |

52
The Corporation models additional interest rate scenar-
ios covering a wider range of rate movements to identify
yield curve, term structure and basis risk exposures. These
scenarios are developed based on historical rate relation-
ships or management’s expectations regarding the future
direction and level of interest rates. Depending on market
conditions and other factors, these scenarios may be mod-
eled more or less frequently. Such analyses are used to
identify inherent risk and develop appropriate strategies.
An economic value of equity model is used by the
Corporation to value all current on-balance-sheet and off-
balance-sheet positions under a range of instantaneous
interest rate changes. The resulting change in the value of
equity is the measure of overall long-term interest rate risk
inherent in the Corporation’s existing on-balance-sheet and
off-balance-sheet positions. The Corporation uses the eco-
nomic value of equity model to complement the net interest
income simulation modeling process.
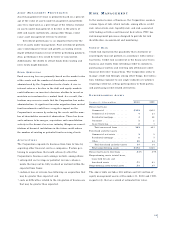
The Corporation’s risk management policies provide
that the change in economic value of equity should not
decline by more than 1.5% of the book value of assets for a
200 basis point instantaneous increase or decrease in inter-
est rates. Based on the results of the economic value of
equity model at December 31, 2000, if interest rates were to
instantaneously increase by 200 basis points, the model
indicated that the economic value of existing on-balance-
sheet and off-balance-sheet positions would decline by .8%
of assets. If interest rates were to instantaneously decrease
by 200 basis points, the model indicated that the economic
value of existing on-balance-sheet and off-balance-sheet
positions would decrease by .1% of assets.
LI Q U I D I T Y RI S K
Liquidity represents the Corporation’s ability to obtain cost-
effective funding to meet the needs of customers as well as
the Corporation’s financial obligations. Liquidity is centrally
managed by Asset and Liability Management, with oversight
provided by the Corporate Asset and Liability Committee
and the Finance Committee of the Board of Directors.
Access to capital markets funding sources is a key fac-
tor affecting liquidity management. Access to such markets
is in part based on the Corporation’s credit ratings, which
are influenced by a number of factors including capital
ratios, credit quality and earnings. Additional factors that
impact liquidity include the maturity structure of existing
assets, liabilities, and off-balance-sheet positions, the level
of liquid securities and loans available for sale, and the
Corporation’s ability to securitize and sell various types
of loans.
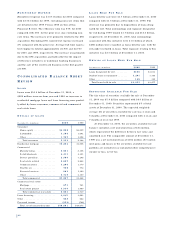
Liquidity can also be provided through the sale of
liquid assets, which consist of short-term investments,
loans held for sale and securities available for sale. At
December 31, 2000, such assets totaled $8.7 billion, with
$3.8 billion pledged as collateral for borrowings, trust and
other commitments. Liquidity can also be obtained through
secured advances from the Federal Home Loan Bank, of
which PNC Bank, N.A., PNC’s largest bank subsidiary, is a
member. These borrowings are generally secured by resi-
dential mortgages and mortgage-backed securities. At
December 31, 2000, approximately $7.3 billion of residen-
tial mortgages were available as collateral for borrowings
from the Federal Home Loan Bank. Funding can also be
obtained through alternative forms of borrowing, including
federal funds purchased, repurchase agreements and short-
term and long-term debt issuances.
Liquidity for the parent company and subsidiaries is
also generated through the issuance of securities in public
or private markets and lines of credit. At December 31,
2000, the Corporation had unused capacity under effective
shelf registration statements of approximately $1.4 billion of
debt and equity securities and $400 million of trust pre-
ferred capital securities. In addition, the Corporation had an
unused line of credit of $500 million.
The principal source of parent company revenue and
cash flow is dividends from subsidiary banks. PNC
Bancorp, Inc. is a wholly-owned subsidiary of the parent
company and is the holding company for all bank sub-
sidiaries. There are legal limitations on the ability of bank
subsidiaries to pay dividends and make other distributions
to PNC Bancorp, Inc. and in turn to the parent company.
Without regulatory approval, the amount available for divi-
dend payments to PNC Bancorp, Inc. by all bank sub-
sidiaries was $634 million at December 31, 2000.
Dividends may also be impacted by capital needs, regulato-
ry requirements, corporate policies, contractual restrictions
and other factors.
Management believes the Corporation has sufficient
liquidity to meet current obligations to borrowers, deposi-
tors, debt holders and others. The impact of replacing
maturing liabilities is reflected in the income simulation
model in the overall asset and liability management
process.