PNC Bank 2000 Annual Report Download - page 45
Download and view the complete annual report
Please find page 45 of the 2000 PNC Bank annual report below. You can navigate through the pages in the report by either clicking on the pages listed below, or by using the keyword search tool below to find specific information within the annual report.-
 1
1 -
2
-
3
-
4
-
5
-
6
-
7
-
8
-
9
-
10
-
11
-
12
-
13
-
14
-
15
-
16
-
17
-
18
-
19
-
20
-
21
-
22
-
23
-
24
-
25
-
26
-
27
-
28
-
29
-
30
-
31
-
32
-
33
-
34
-
 35
35 -
 36
36 -
 37
37 -
 38
38 -
 39
39 -
 40
40 -
 41
41 -
 42
42 -
 43
43 -
 44
44 -
 45
45 -
 46
46 -
 47
47 -
 48
48 -
 49
49 -
 50
50 -
 51
51 -
 52
52 -
 53
53 -
 54
54 -
 55
55 -
56
-
57
-
58
-
59
-
60
-
61
-
62
-
63
-
64
-
65
-
66
-
67
-
68
-
69
-
70
-
71
-
72
-
73
-
74
-
75
-
76
-
77
-
78
-
79
-
80
-
81
-
82
-
83
-
84
-
85
-
86
-
87
-
88
-
89
-
90
-
91
-
92
-
93
-
94
-
95
-
96
 |
 |

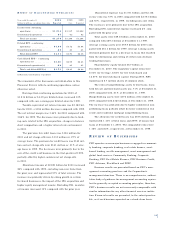
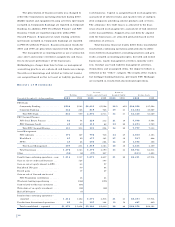
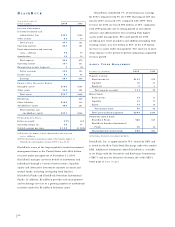
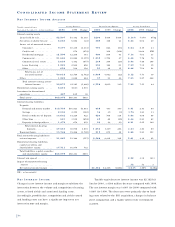
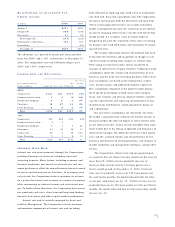
BlackRock contributed 7% of total business earnings
for 2000 compared with 5% for 1999. Earnings of $87 mil-
lion for 2000 increased 47% compared with 1999. Total
revenue for 2000 increased $96 million or 25% compared
with 1999 primarily due to strong growth in investment
advisory and administrative fees resulting from higher
assets under management. Net asset growth for 2000,
including new client mandates and additional funding from
existing clients, was $33 billion or 85% of the $39 billion
increase in assets under management. The increase in oper-
ating expense in the period-to-period comparison supported
revenue growth.
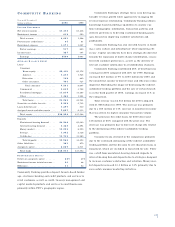
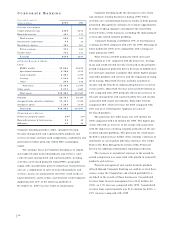
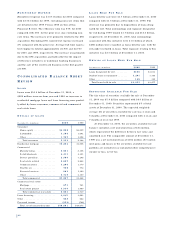
AS S E T S UN D E R MA N A G E M E N T
Year ended December 31
December 31 – in billions 2000 1999
Separate accounts
Fixed income (a) . . . . . . . . . . . . . $107 $75
Liquidity . . . . . . . . . . . . . . . . . . . 18 21
Equity (a) . . . . . . . . . . . . . . . . . . 93
Total separate accounts . . . . . . 134 99
Mutual funds
Fixed income . . . . . . . . . . . . . . . 13 13
Liquidity . . . . . . . . . . . . . . . . . . . 43 37
Equity . . . . . . . . . . . . . . . . . . . . . 14 16
Total mutual funds . . . . . . . . . . 70 66
Total assets under management . . $204 $165
Proprietary mutual funds
BlackRock Funds . . . . . . . . . . . . $26 $27
BlackRock Provident Institutional
Funds . . . . . . . . . . . . . . . . . . . 36 26
Total proprietary mutual funds . . . $62 $53
(a) Includes alternative investment products.
BlackRock, Inc. is approximately 70% owned by PNC and
is listed on the New York Stock Exchange under the symbol
BLK. Additional information about BlackRock is available
in its filings with the Securities and Exchange Commission
(“SEC”) and may be obtained electronically at the SEC’s
home page at www.sec.gov.
42
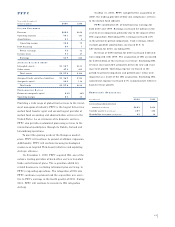
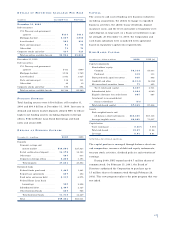
BL A C K RO C K
Year ended December 31
Dollars in millions 2000 1999
IN C O M E ST A T E M E N T
Investment advisory and
administrative fees . . . . . . . . . . . $453 $362
Other income . . . . . . . . . . . . . . . . . 24 19
Total revenue . . . . . . . . . . . . . . . 477 381
Operating expense . . . . . . . . . . . . . 248 181
Fund administration and servicing
costs – affiliates . . . . . . . . . . . . . 76 79
Amortization . . . . . . . . . . . . . . . . . . 10 10
Total expense . . . . . . . . . . . . . . . 334 270
Operating income . . . . . . . . . . . . . . 143 111
Nonoperating income (expense) . . . . 7(8)
Pretax earnings . . . . . . . . . . . . . . 150 103
Income taxes . . . . . . . . . . . . . . . . . . 63 44
Earnings . . . . . . . . . . . . . . . . . . . $87 $59
PE R I O D - EN D BA L A N C E SH E E T
Intangible assets . . . . . . . . . . . . . . . $192 $194
Other assets . . . . . . . . . . . . . . . . . . 345 254
Total assets . . . . . . . . . . . . . . . . . $537 $448
Borrowings . . . . . . . . . . . . . . . . . . . $28
Other liabilities . . . . . . . . . . . . . . . . $169 139
Stockholders’ equity . . . . . . . . . . . . 368 281
Total liabilities and
stockholders’ equity . . . . . . . . . $537 $448
PE R F O R M A N C E DATA
Return on equity . . . . . . . . . . . . . . . 27% 36%
Operating margin (a) . . . . . . . . . . . . 36 37
Diluted earnings per share . . . . . . . $1.35 $1.04(b)
(a) Excludes the impact of fund administration and servicing
costs – affiliates.
(b) Proforma diluted earnings per share reflecting the impact of
BlackRock’s initial public offering (“IPO”) were $0.99.
BlackRock is one of the largest publicly traded investment
management firms in the United States with $204 billion
of assets under management at December 31, 2000.
BlackRock manages assets on behalf of institutions and
individuals through a variety of fixed income, liquidity,
equity and alternative investment separate accounts and
mutual funds, including its flagship fund families,
BlackRock Funds and BlackRock Provident Institutional
Funds. In addition, BlackRock provides risk management
and technology services to a growing number of institutional
investors under the BlackRock Solutions name.