PNC Bank 2000 Annual Report Download - page 65
Download and view the complete annual report
Please find page 65 of the 2000 PNC Bank annual report below. You can navigate through the pages in the report by either clicking on the pages listed below, or by using the keyword search tool below to find specific information within the annual report.-
 1
1 -
2
-
3
-
4
-
5
-
6
-
7
-
8
-
9
-
10
-
11
-
12
-
13
-
14
-
15
-
16
-
17
-
18
-
19
-
20
-
21
-
22
-
23
-
24
-
25
-
26
-
27
-
28
-
29
-
30
-
31
-
32
-
33
-
34
-
35
-
36
-
37
-
38
-
39
-
40
-
41
-
42
-
43
-
44
-
45
-
46
-
47
-
48
-
49
-
50
-
51
-
52
-
53
-
54
-
 55
55 -
 56
56 -
 57
57 -
 58
58 -
 59
59 -
 60
60 -
 61
61 -
 62
62 -
 63
63 -
 64
64 -
 65
65 -
 66
66 -
 67
67 -
 68
68 -
 69
69 -
 70
70 -
 71
71 -
 72
72 -
 73
73 -
 74
74 -
 75
75 -
76
-
77
-
78
-
79
-
80
-
81
-
82
-
83
-
84
-
85
-
86
-
87
-
88
-
89
-
90
-
91
-
92
-
93
-
94
-
95
-
96
 |
 |

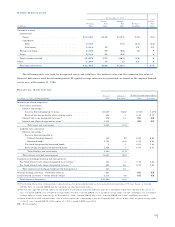
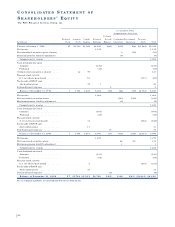
CO N S O L I D AT E D STAT E M E N T O F
SH A R E H O L D E R S ’ EQ U I T Y
The PNC Financial Services Group, Inc.
Accumulated Other
Comprehensive Loss from
Deferred
Preferred Common Capital Retained Benefit Continuing D i s c o n t i n u e d T reas ur y
In millions Stock Stock Surplus Earnings Expense Operations Operations Stock Total
Balance at January 1, 1998 . . . . . . . . . . . $7 $1,742 $1,042 $4,641 $(41) $(19) $(4) $(1,984) $5,384
Net income . . . . . . . . . . . . . . . . . . . . . . . 1,115 1,115
Net unrealized securities gains (losses) . . . 2 (15) (13)
Minimum pension liability adjustment . . . (7) (7)
Comprehensive income . . . . . . . . . . . . . 1,095
Cash dividends declared
Common . . . . . . . . . . . . . . . . . . . . . . . (476) (476)
Preferred . . . . . . . . . . . . . . . . . . . . . . . (19) (19)
Common stock issued (4.4 shares) . . . . . . 22 99 121
Treasury stock activity
(1.1 net shares purchased) . . . . . . . . . . 90 (177) (87)
Tax benefit of ESOP and
stock option plans . . . . . . . . . . . . . . . . 19 1 20
Deferred benefit expense . . . . . . . . . . . . . 5 5
Balance at December 31, 1998 . . . . . . . 7 1,764 1,250 5,262 (36) (24) (19) (2,161) 6,043
Net income . . . . . . . . . . . . . . . . . . . . . . . 1,264 1,264
Net unrealized securities losses . . . . . . . . (103) (116) (219)
Minimum pension liability adjustment . . . (5) (5)
Comprehensive income . . . . . . . . . . . . . 1,040
Cash dividends declared
Common . . . . . . . . . . . . . . . . . . . . . . . (501) (501)
Preferred . . . . . . . . . . . . . . . . . . . . . . . (19) (19)
Treasury stock activity
(11.0 net shares purchased) . . . . . . . . . 13 (662) (649)
Tax benefit of ESOP and
stock option plans . . . . . . . . . . . . . . . . 13 13
Deferred benefit expense . . . . . . . . . . . . . 19 19
Balance at December 31, 1999 . . . . . . . 7 1,764 1,276 6,006 (17) (132) (135) (2,823) 5,946
Net income . . . . . . . . . . . . . . . . . . . . . . . 1,279 1,279
Net unrealized securities gains . . . . . . . . . 88 90 178
Minimum pension liability adjustment . . . 1 1
Comprehensive income . . . . . . . . . . . . . 1,458
Cash dividends declared
Common . . . . . . . . . . . . . . . . . . . . . . . (530) (530)
Preferred . . . . . . . . . . . . . . . . . . . . . . . (19) (19)
Treasury stock activity
(3.1 net shares purchased) . . . . . . . . . . 6 (218) (212)
Tax benefit of ESOP and
stock option plans . . . . . . . . . . . . . . . . 21 21
Deferred benefit expense . . . . . . . . . . . . . (8) (8)
Balance at December 31, 2000 . . . $7 $1,7 6 4 $1 ,303 $6,736 $(25) $( 43) $( 45) $(3,041) $6,656
See accompanying Notes to Consolidated Financial Statements.
62