PNC Bank 2000 Annual Report Download - page 39
Download and view the complete annual report
Please find page 39 of the 2000 PNC Bank annual report below. You can navigate through the pages in the report by either clicking on the pages listed below, or by using the keyword search tool below to find specific information within the annual report.-
 1
1 -
2
-
3
-
4
-
5
-
6
-
7
-
8
-
9
-
10
-
11
-
12
-
13
-
14
-
15
-
16
-
17
-
18
-
19
-
20
-
21
-
22
-
23
-
24
-
25
-
26
-
27
-
28
-
 29
29 -
 30
30 -
 31
31 -
 32
32 -
 33
33 -
 34
34 -
 35
35 -
 36
36 -
 37
37 -
 38
38 -
 39
39 -
 40
40 -
 41
41 -
 42
42 -
 43
43 -
 44
44 -
 45
45 -
 46
46 -
 47
47 -
 48
48 -
 49
49 -
50
-
51
-
52
-
53
-
54
-
55
-
56
-
57
-
58
-
59
-
60
-
61
-
62
-
63
-
64
-
65
-
66
-
67
-
68
-
69
-
70
-
71
-
72
-
73
-
74
-
75
-
76
-
77
-
78
-
79
-
80
-
81
-
82
-
83
-
84
-
85
-
86
-
87
-
88
-
89
-
90
-
91
-
92
-
93
-
94
-
95
-
96
 |
 |

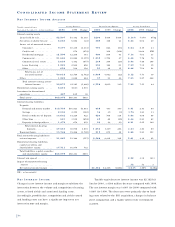
The presentation of business results was changed to
reflect the Corporation’s operating structure during 2000.
Middle market and equipment leasing activities (previously
included in Community Banking) are reported in Corporate
Banking. In addition, PNC Real Estate Finance and PNC
Business Credit are reported separately within PNC
Secured Finance. Regional real estate lending activities
(previously included in Community Banking) are reported
in PNC Real Estate Finance. Business financial results for
2000 and 1999 are presented consistent with this structure.
The management accounting process uses various bal-
ance sheet and income statement assignments and trans-
fers to measure perf o rmance of the businesses.
Methodologies change from time to time as management
accounting practices are enhanced and businesses change.
Securities or borrowings and related net interest income
a re assigned based on the net asset or liability position of
each business. Capital is assigned based on management’s
assessment of inherent risks and equity levels at indepen-
dent companies providing similar products and serv i c e s .
The allowance for credit losses is allocated to the busi-
nesses based on management’s assessment of risk inhere n t
in the loan portfolios. Support areas not directly aligned
with the businesses are allocated primarily based on the
utilization of serv i c e s .
Total business financial results differ from consolidated
results from continuing operations primarily due to differ-
ences between management accounting practices and gen-
erally accepted accounting principles, divested and exited
businesses, equity management activities, minority inter-
ests, residual asset and liability management activities,
eliminations and unassigned items, the impact of which is
reflected in the “Other” category. The results of the residen-
tial mortgage banking business, previously PNC Mortgage,
are included in results from discontinued operations.
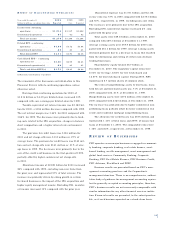
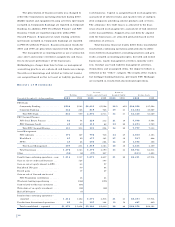
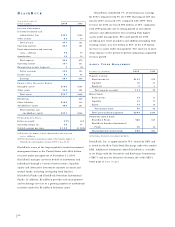
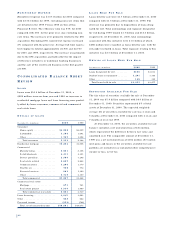
RE S U LT S O F BU S I N E S S E S
Revenue Return on
Earnings (taxable-equivalent basis) Assigned Capital Average Assets
Year ended December 31 – dollars in millions 2000 1999 2000 1999 2000 1999 2000 1999
PNC Bank
Community Banking . . . . . . . . . . . . . $590 $543 $2,033 $1,968 22% 21% $ 38,958 $37,502
Corporate Banking . . . . . . . . . . . . . . 244 246 839 745 20 21 16,382 15,587
Total PNC Bank . . . . . . . . . . . . . . 834 789 2,872 2,713 2 2 21 55,340 53,089
PNC Secured Finance
PNC Real Estate Finance . . . . . . . . . 82 74 220 212 21 19 5,506 5,554
PNC Business Credit . . . . . . . . . . . . 49 29 119 82 32 25 2,271 1,759
Total PNC Secured Finance . . . . . 131 103 339 294 24 20 7,777 7,313
Asset Management
PNC Advisors . . . . . . . . . . . . . . . . . 173 147 792 738 32 27 3,500 3,353
BlackRock . . . . . . . . . . . . . . . . . . . . 87 59 477 381 27 36 537 448
PFPC . . . . . . . . . . . . . . . . . . . . . . . . 47 45 690 264 22 40 1,578 308
Total Asset Management . . . . . . . . 307 251 1,959 1,383 28 30 5,615 4,109
Total businesses . . . . . . . . . . . . . . . . 1,272 1,143 5,170 4,390 23 23 68,732 64,511
Other . . . . . . . . . . . . . . . . . . . . . . . . (58) (6) (97) 227 (241) 3,403
Results from continuing operations – core 1,214 1,137 5,073 4,617 21 20 68,491 67,914
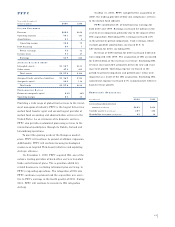
Gain on sale of credit card business . . . . 125 193
Gain on sale of equity interest in EPS . . . 63 97
BlackRock IPO gain . . . . . . . . . . . . . . . 59 64
Branch gains . . . . . . . . . . . . . . . . . . . . . 17 27
Gain on sale of Concord stock net of
PNC Foundation contribution . . . . . . . 16 41
Wholesale lending re p o s i t i o n i n g . . . . . . . (126) (195)
Costs related to efficiency initiatives . . . . (64)
Write-down of an equity investment . . . . (18) (28)
Mall ATM buyout . . . . . . . . . . . . . . . . . (7)
Results from continuing operations –
re p o rt e d . . . . . . . . . . . . . . . . . . . . . . 1,214 1,202 5,073 4,816 21 21 68,491 67,914
Results from discontinued operations . . 65 62 307 384 13 14 487 449
Total consolidated – reported . . . . . . $1,279 $1,264 $5,380 $5,200 22 22 $68,978 $68,363
36