PNC Bank 2000 Annual Report Download - page 50
Download and view the complete annual report
Please find page 50 of the 2000 PNC Bank annual report below. You can navigate through the pages in the report by either clicking on the pages listed below, or by using the keyword search tool below to find specific information within the annual report.-
 1
1 -
2
-
3
-
4
-
5
-
6
-
7
-
8
-
9
-
10
-
11
-
12
-
13
-
14
-
15
-
16
-
17
-
18
-
19
-
20
-
21
-
22
-
23
-
24
-
25
-
26
-
27
-
28
-
29
-
30
-
31
-
32
-
33
-
34
-
35
-
36
-
37
-
38
-
39
-
 40
40 -
 41
41 -
 42
42 -
 43
43 -
 44
44 -
 45
45 -
 46
46 -
 47
47 -
 48
48 -
 49
49 -
 50
50 -
 51
51 -
 52
52 -
 53
53 -
 54
54 -
 55
55 -
 56
56 -
 57
57 -
 58
58 -
 59
59 -
 60
60 -
61
-
62
-
63
-
64
-
65
-
66
-
67
-
68
-
69
-
70
-
71
-
72
-
73
-
74
-
75
-
76
-
77
-
78
-
79
-
80
-
81
-
82
-
83
-
84
-
85
-
86
-
87
-
88
-
89
-
90
-
91
-
92
-
93
-
94
-
95
-
96
 |
 |

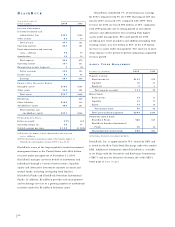
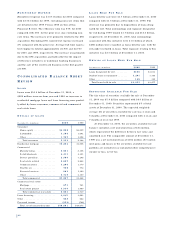
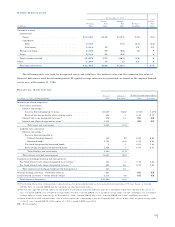
DE TA I L S O F SE C U R I T I E S AV A I L A B L E FO R SA L E
Year ended December 31
In millions Amortized Cost Fair Value
December 31, 2000
Debt securities
U.S. Treasury and government
agencies . . . . . . . . . . . . . . . . . $313 $313
Mortgage-backed . . . . . . . . . . . . . 4,037 4,002
Asset-backed . . . . . . . . . . . . . . . 902 893
State and municipal . . . . . . . . . . . 94 96
Other debt . . . . . . . . . . . . . . . . . 73 73
Corporate stocks and other . . . . . . . 537 525
Total securities available for sale . . $5,956 $5,902
December 31, 1999
Debt securities
U.S. Treasury and government
agencies . . . . . . . . . . . . . . . . . $411 $400
Mortgage-backed . . . . . . . . . . . . . 3,918 3,769
Asset-backed . . . . . . . . . . . . . . . 1,051 1,027
State and municipal . . . . . . . . . . . 134 131
Other debt . . . . . . . . . . . . . . . . . 40 39
Corporate stocks and other . . . . . . . 590 594
Total securities available for sale . . $6,144 $5,960
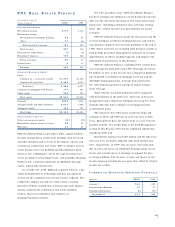
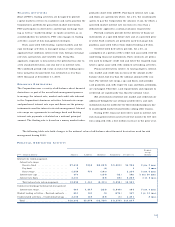
FU N D I N G SO U R C E S
Total funding sources were $59.4 billion at December 31,
2000 and $60.0 billion at December 31, 1999. Increases in
demand and money market deposits allowed PNC to reduce
higher-cost funding sources including deposits in foreign
offices, Federal Home Loan Bank borrowings and bank
notes and senior debt.
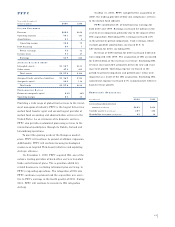
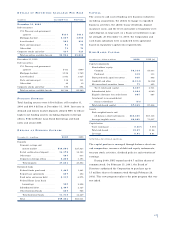
DE TA I L S O F FU N D I N G SO U R C E S
Year ended December 31
December 31 – in millions 2000 1999
Deposits
Demand, savings and
money market . . . . . . . . . . . . . $30,686 $27,823
Retail certificates of deposit . . . . . 14,175 14,153
Other time . . . . . . . . . . . . . . . . . 567 633
Deposits in foreign offices . . . . . . 2,236 3,193
Total deposits . . . . . . . . . . . . . 47,664 45,802
Borrowed funds
Federal funds purchased . . . . . . . 1,445 1,281
Repurchase agreements . . . . . . . . 607 402
Bank notes and senior debt . . . . . 6,110 6,975
Federal Home Loan Bank
borrowings . . . . . . . . . . . . . . . 500 2,258
Subordinated debt . . . . . . . . . . . . 2,407 2,327
Other borrowed funds . . . . . . . . . 649 986
Total borrowed funds . . . . . . . . 11,718 14,229
Total . . . . . . . . . . . . . . . . . . . . . . $59,382 $60,031
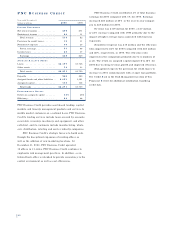
CA P I TA L
The access to and cost of funding new business initiatives
including acquisitions, the ability to engage in expanded
business activities, the ability to pay dividends, deposit
insurance costs, and the level and nature of regulatory over-
sight depend, in large part, on a financial institution’s capi-
tal strength. At December 31, 2000, the Corporation and
each bank subsidiary were considered well capitalized
based on regulatory capital ratio requirements.
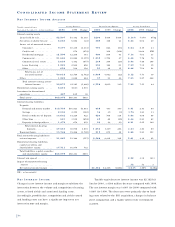
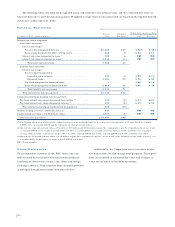
RI S K - B A S E D CA P I TA L
Year ended December 31
December 31 – dollars in millions 2000 1999 (a)
Capital components
Shareholders’ equity
Common . . . . . . . . . . . . . . . . . $6,344 $5,633
Preferred . . . . . . . . . . . . . . . . . 312 313
Trust preferred capital securities . 848 848
Goodwill and other . . . . . . . . . . . (2,214) (2,318)
Net unrealized securities losses . . 77 255
Tier I risk-based capital . . . . . . 5,367 4,731
Subordinated debt . . . . . . . . . . . . 1,824 2,040
Eligible allowance for credit losses 667 667
Investment in unconsolidated
finance subsidiary . . . . . . . . . . (13)
Total risk-based capital . . . . . . . . $7,845 $7,438
Assets
Risk-weighted assets and
off-balance-sheet instruments . $62,430 $67,118
Average tangible assets . . . . . . . . 66,809 71,617
Capital ratios
Tier I risk-based . . . . . . . . . . . . . 8.60% 7.05%
Total risk-based . . . . . . . . . . . . . . 12.57 11.08
Leverage . . . . . . . . . . . . . . . . . . . 8.03 6.61
(a) Includes discontinued operations.
The capital position is managed through balance sheet size
and composition, issuance of debt and equity instruments,
treasury stock activities, dividend policies and retention of
earnings.
During 2000, PNC repurchased 6.7 million shares of
common stock. On February 15, 2001, the Board of
Directors authorized the Corporation to purchase up to
15 million shares of common stock through February 28,
2002. This new program replaces the prior program that was
rescinded.
47