PNC Bank 2000 Annual Report Download - page 13
Download and view the complete annual report
Please find page 13 of the 2000 PNC Bank annual report below. You can navigate through the pages in the report by either clicking on the pages listed below, or by using the keyword search tool below to find specific information within the annual report.-
 1
1 -
2
-
 3
3 -
 4
4 -
 5
5 -
 6
6 -
 7
7 -
 8
8 -
 9
9 -
 10
10 -
 11
11 -
 12
12 -
 13
13 -
 14
14 -
 15
15 -
 16
16 -
 17
17 -
 18
18 -
 19
19 -
 20
20 -
 21
21 -
 22
22 -
 23
23 -
24
-
25
-
26
-
27
-
28
-
29
-
30
-
31
-
32
-
33
-
34
-
35
-
36
-
37
-
38
-
39
-
40
-
41
-
42
-
43
-
44
-
45
-
46
-
47
-
48
-
49
-
50
-
51
-
52
-
53
-
54
-
55
-
56
-
57
-
58
-
59
-
60
-
61
-
62
-
63
-
64
-
65
-
66
-
67
-
68
-
69
-
70
-
71
-
72
-
73
-
74
-
75
-
76
-
77
-
78
-
79
-
80
-
81
-
82
-
83
-
84
-
85
-
86
-
87
-
88
-
89
-
90
-
91
-
92
-
93
-
94
-
95
-
96
 |
 |
11
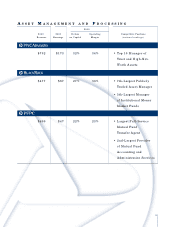
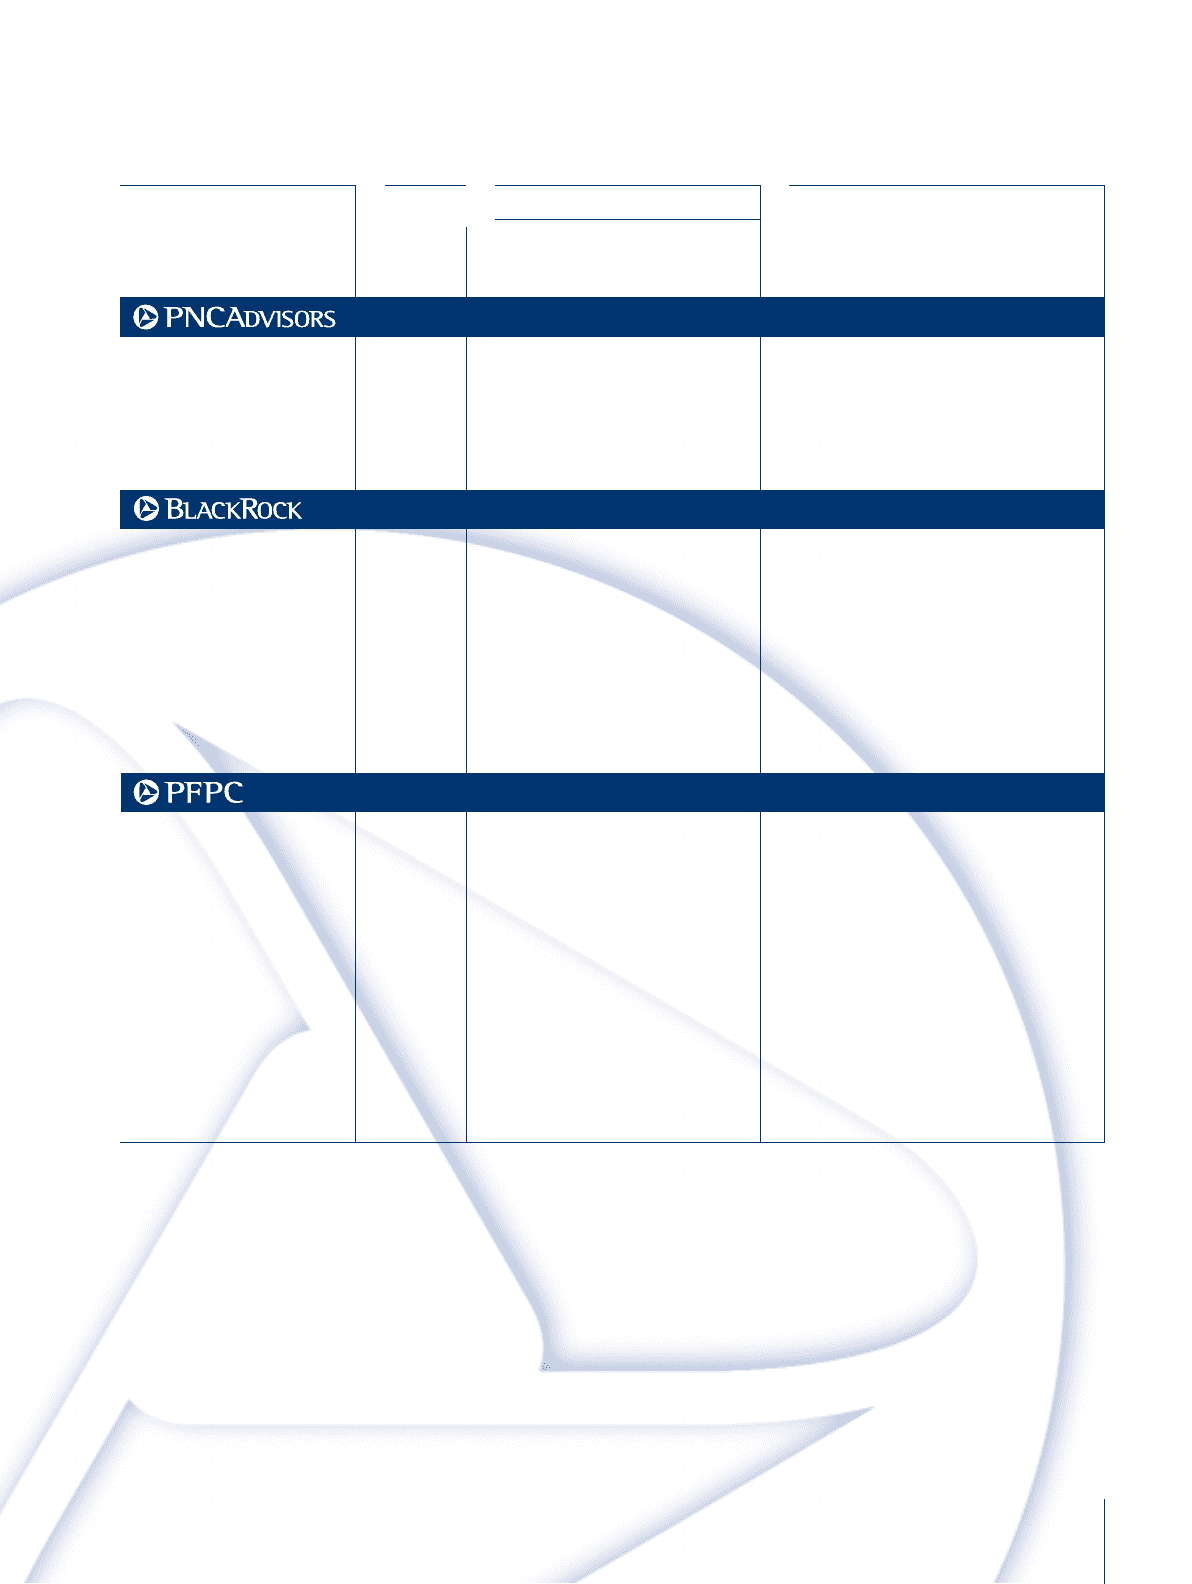
ASSET MANAGEMENT AND PROCESSING
2000
2000 2000 Return Operating Competitive Positions
Revenue Earnings on Capital Margin (national rankings)
$792 $173 32% 34% • Top 10 Manager of
Trust and High-Net-
Worth Assets
$477 $87 27% 36% • 7th-Largest Publicly
Traded Asset Manager
• 5th-Largest Manager
of Institutional Money
Market Funds
$690 $47 22% 23% • Largest Full-Service
Mutual Fund
Transfer Agent
• 2nd-Largest Provider
of Mutual Fund
Accounting and
Administration Services