PNC Bank 2000 Annual Report Download - page 90
Download and view the complete annual report
Please find page 90 of the 2000 PNC Bank annual report below. You can navigate through the pages in the report by either clicking on the pages listed below, or by using the keyword search tool below to find specific information within the annual report.-
 1
1 -
2
-
3
-
4
-
5
-
6
-
7
-
8
-
9
-
10
-
11
-
12
-
13
-
14
-
15
-
16
-
17
-
18
-
19
-
20
-
21
-
22
-
23
-
24
-
25
-
26
-
27
-
28
-
29
-
30
-
31
-
32
-
33
-
34
-
35
-
36
-
37
-
38
-
39
-
40
-
41
-
42
-
43
-
44
-
45
-
46
-
47
-
48
-
49
-
50
-
51
-
52
-
53
-
54
-
55
-
56
-
57
-
58
-
59
-
60
-
61
-
62
-
63
-
64
-
65
-
66
-
67
-
68
-
69
-
70
-
71
-
72
-
73
-
74
-
75
-
76
-
77
-
78
-
79
-
 80
80 -
 81
81 -
 82
82 -
 83
83 -
 84
84 -
 85
85 -
 86
86 -
 87
87 -
 88
88 -
 89
89 -
 90
90 -
 91
91 -
 92
92 -
 93
93 -
 94
94 -
 95
95 -
 96
96
 |
 |

87
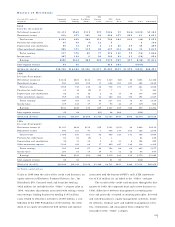
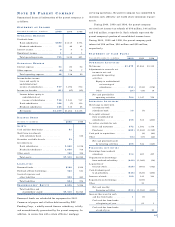
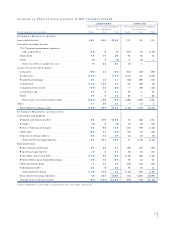
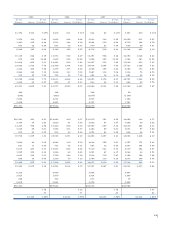
AN A LY S I S O F YE A R -T O - Y E A R CH A N G E S I N NE T IN T E R E S T IN C O M E
2000/1999 1999/1998
Increase/(Decrease) in Income/Expense Increase/(Decrease) in Income/Expense
Due to Changes in: Due to Changes in:
Taxable-equivalent basis - in millions Volume Rate Total Volume Rate Total
IN T E R E S T - EA R N I N G AS S E T S
Loans held for sale . . . . . . . . . . . . . . . . . . . . . . . . . . . . . $90 $10 $100 $71 $2 $73
Securities available for sale
U.S. Treasury, government agencies
and corporations . . . . . . . . . . . . . . . . . . . . . . . . . . . (12) 8 (4) (93) (7) (100)
Other debt . . . . . . . . . . . . . . . . . . . . . . . . . . . . . . . . . 19 10 29 96 (2) 94
Other . . . . . . . . . . . . . . . . . . . . . . . . . . . . . . . . . . . . . (7) 5 (2) 8 (2) 6
Total securities available for sale . . . . . . . . . . . . . . . (1) 24 23 (3) 3
Loans, net of unearned income
Consumer . . . . . . . . . . . . . . . . . . . . . . . . . . . . . . . . . . (96) 43 (53) (64) (32) (96)
Credit card . . . . . . . . . . . . . . . . . . . . . . . . . . . . . . . . . (100) (100) (471) 33 (438)
Residential mortgage . . . . . . . . . . . . . . . . . . . . . . . . . 25 16 41 (12) (29) (41)
Commercial . . . . . . . . . . . . . . . . . . . . . . . . . . . . . . . . (112) 159 47 25 (27) (2)
Commercial real estate . . . . . . . . . . . . . . . . . . . . . . . . (58) 33 (25) 7 (19) (12)
Lease financing . . . . . . . . . . . . . . . . . . . . . . . . . . . . . 48 5 53 38 1 39
Other . . . . . . . . . . . . . . . . . . . . . . . . . . . . . . . . . . . . . 10 5 15 25 1 26
Total loans, net of unearned income . . . . . . . . . . . . . (221) 199 (22) (228) (296) (524)
Other . . . . . . . . . . . . . . . . . . . . . . . . . . . . . . . . . . . . . . 14 30 44 7 (1) 6
Total interest-earning assets . . . . . . . . . . . . . . . . . . . . (108) 253 $145 (138) (307) $(445)
IN T E R E S T - B E A R I N G LI A B I L I T I E S
Interest-bearing deposits
Demand and money market . . . . . . . . . . . . . . . . . . . . . 56 109 $165 78 (24) $54
Savings . . . . . . . . . . . . . . . . . . . . . . . . . . . . . . . . . . . . (6) 3 (3) (4) (8) (12)
Retail certificates of deposit . . . . . . . . . . . . . . . . . . . . 22 96 118 (61) (57) (118)
Other time . . . . . . . . . . . . . . . . . . . . . . . . . . . . . . . . . (56) 11 (45) (15) (3) (18)
Deposits in foreign offices . . . . . . . . . . . . . . . . . . . . . . 36 13 49 (4) (4) (8)
Total interest-bearing deposits . . . . . . . . . . . . . . . . . 63 221 284 37 (139) (102)
Borrowed funds
Federal funds purchased . . . . . . . . . . . . . . . . . . . . . . . 27 24 51 (45) (10) (55)
Repurchase agreements . . . . . . . . . . . . . . . . . . . . . . . 8 6 14 (8) (3) (11)
Bank notes and senior debt . . . . . . . . . . . . . . . . . . . . . (119) 93 (26) (116) (32) (148)
Federal Home Loan Bank borrowings . . . . . . . . . . . . . (49) 12 (37) 49 (4) 45
Other borrowed funds . . . . . . . . . . . . . . . . . . . . . . . . . 7 11 18 (26) (14) (40)
Subordinated debt . . . . . . . . . . . . . . . . . . . . . . . . . . . 26 (1) 25 19 (5) 14
Total borrowed funds . . . . . . . . . . . . . . . . . . . . . . . . (103) 148 45 (140) (55) (195)
Total interest-bearing liabilities . . . . . . . . . . . . . . . . . . (5) 334 $329 (74) (223) $(297)
Change in net interest income . . . . . . . . . . . . . . . . . . . (53) (131) $(184) (69) (79) $(148)
Changes attributable to rate/volume are prorated into rate and volume components.