PNC Bank 2000 Annual Report Download - page 3
Download and view the complete annual report
Please find page 3 of the 2000 PNC Bank annual report below. You can navigate through the pages in the report by either clicking on the pages listed below, or by using the keyword search tool below to find specific information within the annual report.-
 1
1 -
 2
2 -
 3
3 -
 4
4 -
 5
5 -
 6
6 -
 7
7 -
 8
8 -
 9
9 -
 10
10 -
 11
11 -
 12
12 -
 13
13 -
 14
14 -
15
-
16
-
17
-
18
-
19
-
20
-
21
-
22
-
23
-
24
-
25
-
26
-
27
-
28
-
29
-
30
-
31
-
32
-
33
-
34
-
35
-
36
-
37
-
38
-
39
-
40
-
41
-
42
-
43
-
44
-
45
-
46
-
47
-
48
-
49
-
50
-
51
-
52
-
53
-
54
-
55
-
56
-
57
-
58
-
59
-
60
-
61
-
62
-
63
-
64
-
65
-
66
-
67
-
68
-
69
-
70
-
71
-
72
-
73
-
74
-
75
-
76
-
77
-
78
-
79
-
80
-
81
-
82
-
83
-
84
-
85
-
86
-
87
-
88
-
89
-
90
-
91
-
92
-
93
-
94
-
95
-
96
 |
 |
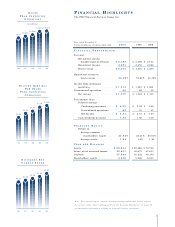
FI N A N C I A L HI G H L I G H T S
The PNC Financial Services Group, Inc.
$991
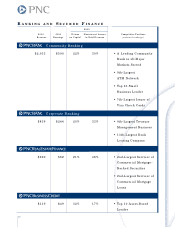
IN C O M E
FR O M CO N T I N U I N G
OP E R AT I O N S
(in millions)
96 97 98 99 00
$1,038 $1,080
$1,202 $1,214
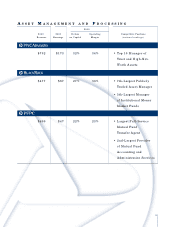
$1.42
DI V I D E N D S PE R
CO M M O N SH A R E
(in millions)
96 97 98 99 00
$1.50 $1.58 $1.68
$1.83
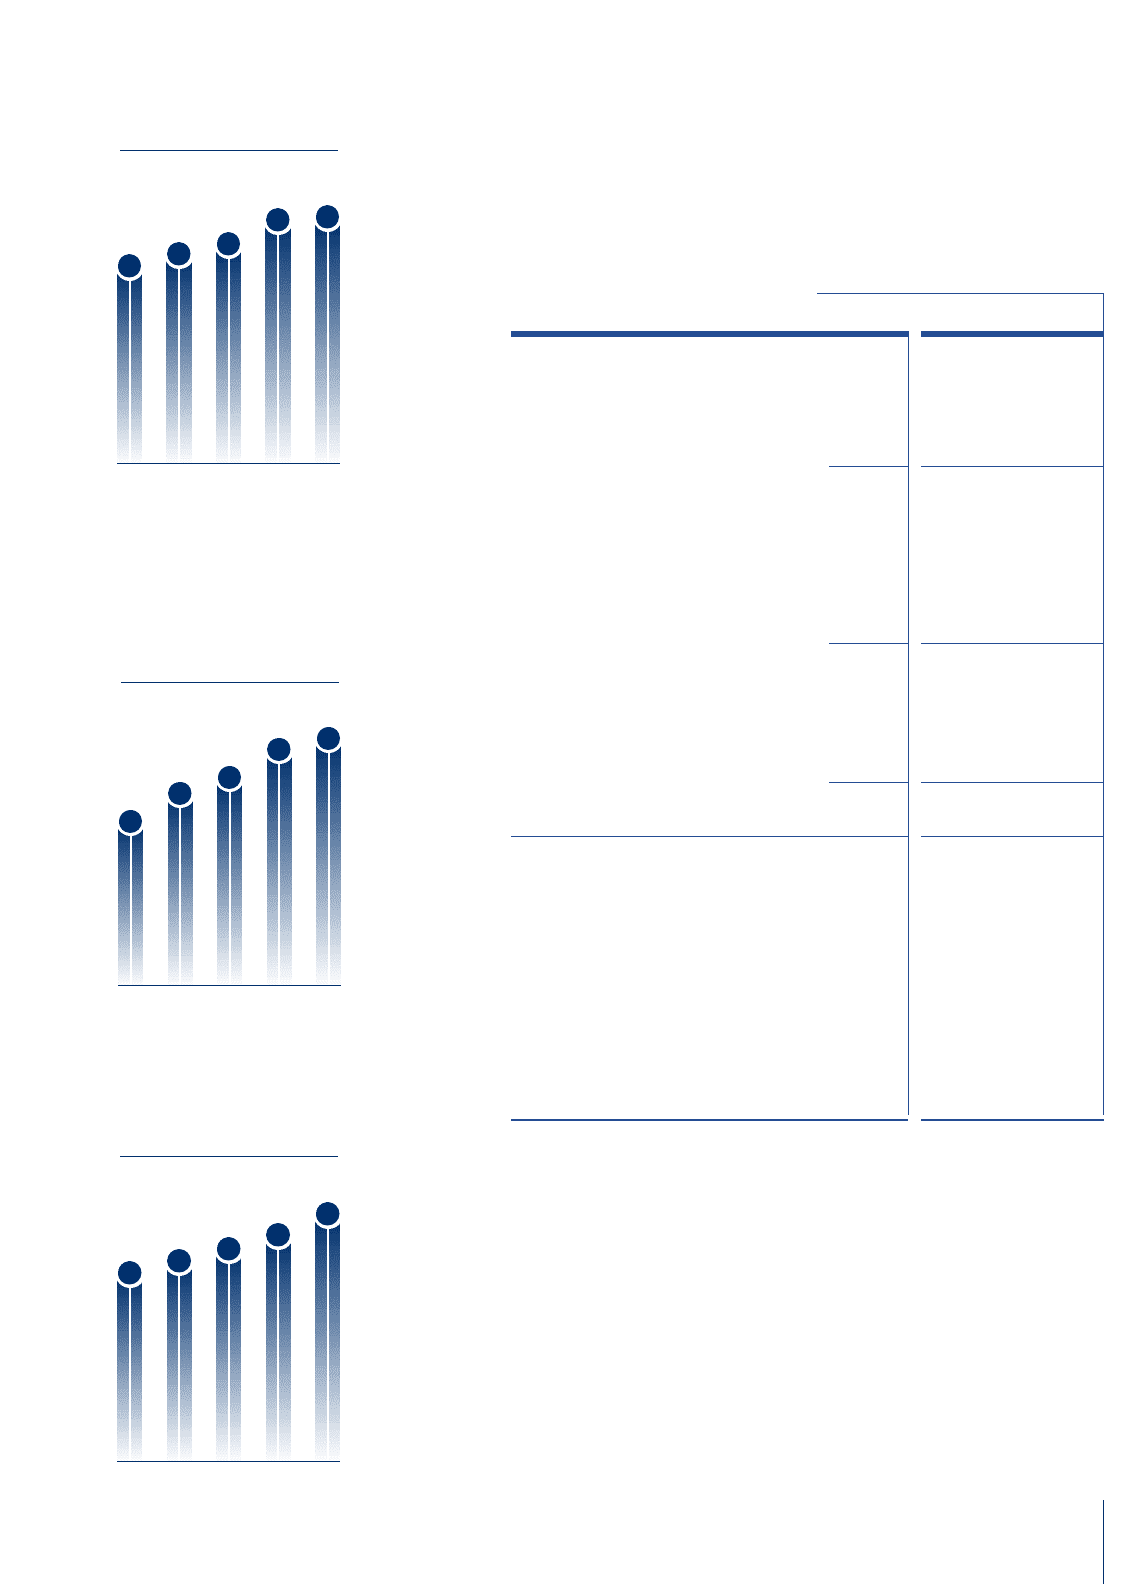
$2.88
DI L U T E D EA R N I N G S
PE R SH A R E
FR O M CO N T I N U I N G
OP E R AT I O N S
(in millions)
96 97 98 99 00
$3.24 $3.49
$3.94 $4.09
Year ended December 31
Dollars in millions, except per share data 2000 1999 1998
FI N A N C I A L PE R F O R M A N C E
Revenue
Net interest income
(taxable-equivalent basis) . . $ 2,182 $ 2,366 $ 2,514
Noninterest income . . . . . . . 2,891 2,450 2,086
Total revenue . . . . . . . . . . . . $ 5,073 $ 4,816 $ 4,600
Noninterest income to
total revenue . . . . . . . . . . . 56.99% 50.87% 45.35%
Income from continuing
operations . . . . . . . . . . . . . . . $ 1,214 $ 1,202 $ 1,080
Discontinued operations . . . . . . . 65 62 35
Net income . . . . . . . . . . . . . $ 1,279 $ 1,264 $ 1,115
Per common share
Diluted earnings
Continuing operations . . . . $ 4.09 $ 3.94 $ 3.49
Discontinued operations . . .22 .21 .11
Net Income . . . . . . . . . . . $ 4.31 $ 4.15 $ 3.60
Cash dividends declared . . . 1.83 1.68 1.58
SE L E C T E D RA T I O S
Return on
Average common
shareholders’ equity . . . . 21.63% 22.41% 20.81%
Average assets . . . . . . . . . . 1.68 1.69 1.49
YE A R -E N D BA L A NC E S
Assets . . . . . . . . . . . . . . . . . . . . $ 69,844 $ 69,286 $ 70,754
Loans, net of unearned income . . 50,601 49,673 57,633
Deposits . . . . . . . . . . . . . . . . . . 47,664 45,802 46,150
Shareholders’ equity . . . . . . . . . 6,656 5,946 6,043
1
Note: This annual report contains forward-looking statements. Please refer to
the section of this report captioned “ Forward-Looking Statements” on page 58
for important information relating to forward-looking statements.