PNC Bank 2000 Annual Report Download - page 56
Download and view the complete annual report
Please find page 56 of the 2000 PNC Bank annual report below. You can navigate through the pages in the report by either clicking on the pages listed below, or by using the keyword search tool below to find specific information within the annual report.-
 1
1 -
2
-
3
-
4
-
5
-
6
-
7
-
8
-
9
-
10
-
11
-
12
-
13
-
14
-
15
-
16
-
17
-
18
-
19
-
20
-
21
-
22
-
23
-
24
-
25
-
26
-
27
-
28
-
29
-
30
-
31
-
32
-
33
-
34
-
35
-
36
-
37
-
38
-
39
-
40
-
41
-
42
-
43
-
44
-
45
-
 46
46 -
 47
47 -
 48
48 -
 49
49 -
 50
50 -
 51
51 -
 52
52 -
 53
53 -
 54
54 -
 55
55 -
 56
56 -
 57
57 -
 58
58 -
 59
59 -
 60
60 -
 61
61 -
 62
62 -
 63
63 -
 64
64 -
 65
65 -
 66
66 -
67
-
68
-
69
-
70
-
71
-
72
-
73
-
74
-
75
-
76
-
77
-
78
-
79
-
80
-
81
-
82
-
83
-
84
-
85
-
86
-
87
-
88
-
89
-
90
-
91
-
92
-
93
-
94
-
95
-
96
 |
 |

53
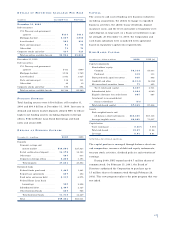
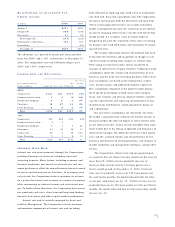
TR A D I N G AC T I V I T I E S
Most of PNC’s trading activities are designed to provide
capital markets services to customers and not to position the
Corporation’s portfolio for gains from market movements.
PNC participates in derivatives and foreign exchange trad-
ing as well as “market making” in equity securities as an
accommodation to customers. PNC also engages in trading
activities as part of risk management strategies.
Risk associated with trading, capital markets and for-
eign exchange activities is managed using a value-at-risk
approach that combines interest rate risk, foreign exchange
rate risk, spread risk and volatility risk. Using this
approach, exposure is measured as the potential loss due to
a two standard deviation, one-day move in interest rates.
The combined period-end value-at-risk of all trading opera-
tions using this measurement was estimated as less than
$500 thousand at December 31, 2000.
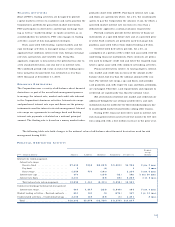
FI N A N C I A L DE R I V A T I V E S
The Corporation uses a variety of off-balance-sheet financial
derivatives as part of the overall risk management process
to manage the interest rate, market and credit risk inherent
in the Corporation’s business activities. Interest rate swaps
and purchased interest rate caps and floors are the primary
instruments used for interest rate risk management. Interest
rate swaps are agreements to exchange fixed and floating
interest rate payments calculated on a notional principal
amount. The floating rate is based on a money market index,
primarily short-term LIBOR. Purchased interest rate caps
and floors are agreements where, for a fee, the counterparty
agrees to pay the Corporation the amount, if any, by which a
specified market interest rate exceeds or is less than a
defined rate applied to a notional amount, respectively.
F o r w a rd contracts provide for the delivery of fin a n c i a l
i n s t r uments at a specified future date and at a specified price
or yield. Such contracts are primarily used to manage risk
positions associated with certain student lending activities.
Credit-related derivatives provide, for a fee, an
assumption of a portion of the credit risk associated with the
underlying financial instruments. Such contracts are prima-
rily used to mitigate credit risk and lower the required regu-
latory capital associated with commercial lending activities.
Financial derivatives involve, to varying degrees, intere s t
rate, market and credit risk in excess of the amount on the
balance sheet, but less than the notional amount of the con-
tract. For interest rate swaps, caps and floors, only periodic
cash payments and, with respect to caps and floors, pre m i u m s ,
a r e exchanged. There f o r e, cash re q u i rements and exposure to
c redit risk are significantly less than the notional value.
Not all elements of interest rate, market and credit risk are
a d d r essed through the use of financial derivatives, and such
i n s t r uments may be ineffective for their intended purposes due
to unanticipated market characteristics among other re a s o n s .
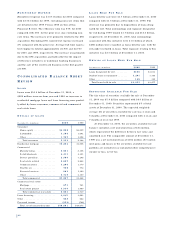
During 2000, financial derivatives used in interest rate
risk management decreased net interest income by $57 mil-
lion compared with a $43 million increase in the prior year.
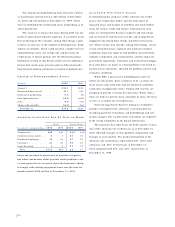
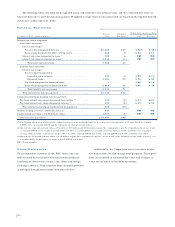
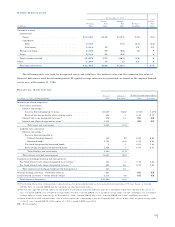
FI N A N C I A L DE R I V A T I V E S AC T I V I T Y
Weighted-
Average
2000 - dollars in millions January 1 Additions Maturities Terminations December 31 Maturity
Interest rate risk management
Interest rate swaps
Receive fixed . . . . . . . . . . . . . . . . . . . . . . . $7,413 $368 $(2,025) $(1,000) $4,756 2 yrs. 9 mos.
Pay fixed . . . . . . . . . . . . . . . . . . . . . . . . . . 5 (4) 1 9 mos.
Basis swaps . . . . . . . . . . . . . . . . . . . . . . . . 1,650 773 (193) 2,230 3 yrs. 6 mos.
Interest rate caps . . . . . . . . . . . . . . . . . . . . . . 474 (134) (32) 308 3 yrs. 10 mos.
Interest rate floors . . . . . . . . . . . . . . . . . . . . . 3,311 (55) (18) 3,238 1 yr. 5 mos.
Total interest rate risk management. . . . . . . 12,853 1,141 (2,411) (1,050) 10,533
Commercial mortgage banking risk management
Interest rate swaps . . . . . . . . . . . . . . . . . . . . . 643 1,617 (228) (1,646) 386 7 yrs. 4 mos.
Student lending activities – Forward contracts . . 681 143 (3) (474) 347 1 yr. 10 mos.
C r e d i t - related activities – Credit default swaps . . 4,315 169 (88) (5) 4,391 8 mos.
Total . . . . . . . . . . . . . . . . . . . . . . . . . . . . . . . $18,492 $3,070 $(2,730) $(3,175) $15,657
The following table sets forth changes in the notional value of off-balance-sheet financial derivatives used for risk
management during 2000.