PNC Bank 2000 Annual Report Download - page 89
Download and view the complete annual report
Please find page 89 of the 2000 PNC Bank annual report below. You can navigate through the pages in the report by either clicking on the pages listed below, or by using the keyword search tool below to find specific information within the annual report.-
 1
1 -
2
-
3
-
4
-
5
-
6
-
7
-
8
-
9
-
10
-
11
-
12
-
13
-
14
-
15
-
16
-
17
-
18
-
19
-
20
-
21
-
22
-
23
-
24
-
25
-
26
-
27
-
28
-
29
-
30
-
31
-
32
-
33
-
34
-
35
-
36
-
37
-
38
-
39
-
40
-
41
-
42
-
43
-
44
-
45
-
46
-
47
-
48
-
49
-
50
-
51
-
52
-
53
-
54
-
55
-
56
-
57
-
58
-
59
-
60
-
61
-
62
-
63
-
64
-
65
-
66
-
67
-
68
-
69
-
70
-
71
-
72
-
73
-
74
-
75
-
76
-
77
-
78
-
 79
79 -
 80
80 -
 81
81 -
 82
82 -
 83
83 -
 84
84 -
 85
85 -
 86
86 -
 87
87 -
 88
88 -
 89
89 -
 90
90 -
 91
91 -
 92
92 -
 93
93 -
 94
94 -
 95
95 -
 96
96
 |
 |

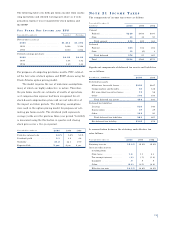
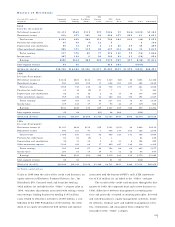
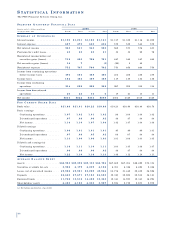
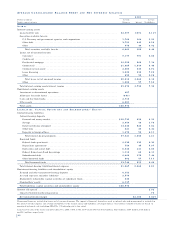
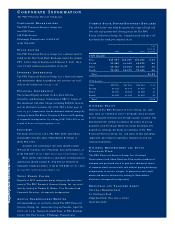
SE L E C T E D QU A R T E R L Y FI N A N C I A L DA TA
Quarter ended – dollars in millions, 2000 1999
except per share data Fourth Third Second First Fourth Third Second First
SU M M A R Y O F OP E R AT I O N S
Interest income . . . . . . . . . . . . . . . $ 1 , 1 9 0 $ 1 , 2 0 1 $ 1 , 1 8 0 $ 1 , 1 6 1 $1,137 $1,125 $1,116 $1,205
Interest expense . . . . . . . . . . . . . . . 6 5 7 6 7 0 6 3 5 6 0 6 575 552 540 572
Net interest income . . . . . . . . . . . . 5 3 3 5 3 1 5 4 5 5 5 5 562 573 576 633
Provision for credit losses . . . . . . . . 4 0 3 0 3 5 3 1 30 30 25 78
Noninterest income before net
securities gains (losses) . . . . . . . . 7 1 9 6 9 3 7 2 8 7 3 1 647 569 547 665
Net securities gains (losses) . . . . . . 1 6 7 ( 3 ) (22) 2 42
Noninterest expense . . . . . . . . . . . . 7 5 2 7 4 7 7 8 0 7 9 2 753 656 684 750
Income from continuing operations
before income taxes . . . . . . . . . . 4 7 6 4 5 4 4 5 8 4 6 0 404 458 456 470
Income taxes . . . . . . . . . . . . . . . . . 1 6 2 1 5 5 1 5 9 1 5 8 117 159 154 156
Income from continuing
operations . . . . . . . . . . . . . . . . . 3 1 4 2 9 9 2 9 9 3 0 2 287 299 302 314
Income from discontinued
operations . . . . . . . . . . . . . . . . . 2 0 2 3 1 6 6 17 21 13 11
Net income . . . . . . . . . . . . . . . . . . $ 3 3 4 $ 3 2 2 $ 3 1 5 $ 3 0 8 $304 $320 $315 $325
PE R CO M M O N SH A R E DA TA
Book value . . . . . . . . . . . . . . . . . . . $ 2 1 . 8 8 $ 2 1 . 0 1 $ 2 0 . 2 2 $ 1 9 . 6 8 $19.23 $18.90 $18.40 $18.78
Basic earnings
Continuing operations . . . . . . . . . 1 . 0 7 1 . 0 2 1 . 0 1 1 . 0 2 .96 1.00 1.00 1.02
Discontinued operations . . . . . . . . 0 7 . 0 8 . 0 6 . 0 2 .06 .07 .04 .04
Net income . . . . . . . . . . . . . . . . . 1 . 1 4 1 . 1 0 1 . 0 7 1 . 0 4 1.02 1.07 1.04 1.06
Diluted earnings
Continuing operations . . . . . . . . . 1 . 0 6 1 . 0 1 1 . 0 1 1 . 0 1 .95 .99 .99 1.01
Discontinued operations . . . . . . . . 0 7 . 0 8 . 0 5 . 0 2 .06 .07 .04 .04
Net income . . . . . . . . . . . . . . . . . 1 . 1 3 1 . 0 9 1 . 0 6 1 . 0 3 1.01 1.06 1.03 1.05
Diluted cash earnings (a)
Continuing operations . . . . . . . . . 1 . 1 6 1 . 1 1 1 . 1 0 1 . 1 1 1.03 1.05 1.06 1.07
Discontinued operations . . . . . . . . 0 6 . 0 8 . 0 6 . 0 2 .06 .07 .04 .04
Net income . . . . . . . . . . . . . . . . . 1 . 2 2 1 . 1 9 1 . 1 6 1 . 1 3 1.09 1.12 1.10 1.11
AV E R A G E BA L A N C E SH E E T
Assets . . . . . . . . . . . . . . . . . . . . . . $ 6 8 , 9 5 3 $ 6 9 , 0 9 8 $ 6 9 , 1 0 5 $ 6 8 , 7 5 6 $67,609 $67,054 $68,499 $70,334
Securities available for sale . . . . . . 5 , 9 2 8 6 , 1 7 9 6 , 0 0 9 6 , 1 2 8 6,351 6,386 6,495 5,086
Loans, net of unearned income . . . . 4 9 , 9 2 8 4 9 , 9 5 1 5 0 , 2 2 9 4 9 , 9 6 6 50,716 51,445 52,439 56,596
Deposits . . . . . . . . . . . . . . . . . . . . 3 8 , 6 6 0 3 7 , 6 7 1 3 7 , 1 8 3 3 6 , 5 5 5 35,363 35,820 35,530 36,161
Borrowed funds . . . . . . . . . . . . . . . 1 1 , 7 3 8 1 3 , 5 1 8 1 4 , 4 2 2 1 5 , 3 3 3 15,341 14,903 15,343 16,294
Shareholders' equity . . . . . . . . . . . . 6 , 4 2 5 6 , 1 8 5 6 , 0 0 5 5 , 9 2 7 5,904 5,732 5,873 5,975
(a) Excluding amortization of goodwill
86
STAT I S T I C A L IN F O R M AT I O N
The PNC Financial Services Group, Inc.