PNC Bank 2000 Annual Report Download - page 43
Download and view the complete annual report
Please find page 43 of the 2000 PNC Bank annual report below. You can navigate through the pages in the report by either clicking on the pages listed below, or by using the keyword search tool below to find specific information within the annual report.-
 1
1 -
2
-
3
-
4
-
5
-
6
-
7
-
8
-
9
-
10
-
11
-
12
-
13
-
14
-
15
-
16
-
17
-
18
-
19
-
20
-
21
-
22
-
23
-
24
-
25
-
26
-
27
-
28
-
29
-
30
-
31
-
32
-
 33
33 -
 34
34 -
 35
35 -
 36
36 -
 37
37 -
 38
38 -
 39
39 -
 40
40 -
 41
41 -
 42
42 -
 43
43 -
 44
44 -
 45
45 -
 46
46 -
 47
47 -
 48
48 -
 49
49 -
 50
50 -
 51
51 -
 52
52 -
 53
53 -
54
-
55
-
56
-
57
-
58
-
59
-
60
-
61
-
62
-
63
-
64
-
65
-
66
-
67
-
68
-
69
-
70
-
71
-
72
-
73
-
74
-
75
-
76
-
77
-
78
-
79
-
80
-
81
-
82
-
83
-
84
-
85
-
86
-
87
-
88
-
89
-
90
-
91
-
92
-
93
-
94
-
95
-
96
 |
 |

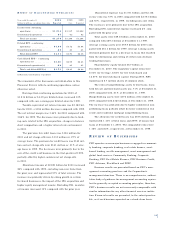
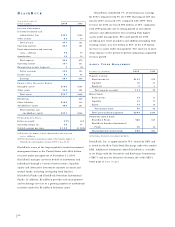
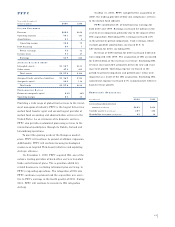
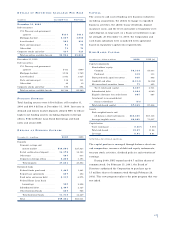
PNC B U S I N E S S CR E D I T
Year ended December 31
Dollars in millions 2000 1999
IN C O M E ST A T E M E N T
Net interest income . . . . . . . . . . . . . . $99 $71
Noninterest income . . . . . . . . . . . . . . 20 11
Total revenue . . . . . . . . . . . . . . . . 119 82
Provision for credit losses . . . . . . . . . 12 11
Noninterest expense . . . . . . . . . . . . . 30 25
Pretax earnings . . . . . . . . . . . . . . . 77 46
Income taxes . . . . . . . . . . . . . . . . . . 28 17
Earnings . . . . . . . . . . . . . . . . . . . . $49 $29
AV E R A G E BA L A N C E SH E E T
Loans . . . . . . . . . . . . . . . . . . . . . . . $2,197 $1,726
Other assets . . . . . . . . . . . . . . . . . . . 74 33
Total assets . . . . . . . . . . . . . . . . . . $2,271 $1,759
Deposits . . . . . . . . . . . . . . . . . . . . . $66 $50
Assigned funds and other liabilities . . 2,053 1,591
Assigned capital . . . . . . . . . . . . . . . . 152 118
Total funds . . . . . . . . . . . . . . . . . . $2,271 $1,759
PE R F O R M A N C E RA T I O S
Return on assigned capital . . . . . . . . 32% 25%
Efficiency . . . . . . . . . . . . . . . . . . . . . 24 28
PNC Business Credit provides asset-based lending, capital
markets and treasury management products and services to
middle market customers on a national basis. PNC Business
Credit’s lending services include loans secured by accounts
receivable, inventory, machinery and equipment, and other
collateral, and its customers include manufacturing, whole-
sale, distribution, retailing and service industry companies.
PNC Business Credit’s strategic focus is to build scale
through the disciplined expansion of existing offices as
well as the addition of new marketing locations. At
December 31, 2000, PNC Business Credit operated
15 offices in 13 states. PNC Business Credit continues to
emphasize risk management practices. In addition, a cen-
tralized back office is intended to provide consistency to the
control environment as well as cost efficiencies.
PNC Business Credit contributed 4% of total business
earnings for 2000 compared with 3% for 1999. Earnings
increased $20 million or 69% in the year-to-year compari-
son to $49 million for 2000.
Revenue was $119 million for 2000, a $37 million
or 45% increase compared with 1999 primarily due to the
impact of higher average loans associated with business
expansion.
Noninterest expense was $30 million and the efficiency
ratio improved to 24% for 2000 compared with $25 million
and 28%, respectively, in 1999. The efficiency ratio
improved in the comparison primarily due to economies of
scale. The return on assigned capital improved to 32% for
2000 due to strong revenue growth and improved efficiency.
Management expects the provision for credit losses to
increase in 2001 commensurate with a larger loan portfolio.
See Credit Risk in the Risk Management section of this
Financial Review for additional information regarding
credit risk.
40