PNC Bank 2000 Annual Report Download - page 48
Download and view the complete annual report
Please find page 48 of the 2000 PNC Bank annual report below. You can navigate through the pages in the report by either clicking on the pages listed below, or by using the keyword search tool below to find specific information within the annual report.-
 1
1 -
2
-
3
-
4
-
5
-
6
-
7
-
8
-
9
-
10
-
11
-
12
-
13
-
14
-
15
-
16
-
17
-
18
-
19
-
20
-
21
-
22
-
23
-
24
-
25
-
26
-
27
-
28
-
29
-
30
-
31
-
32
-
33
-
34
-
35
-
36
-
37
-
 38
38 -
 39
39 -
 40
40 -
 41
41 -
 42
42 -
 43
43 -
 44
44 -
 45
45 -
 46
46 -
 47
47 -
 48
48 -
 49
49 -
 50
50 -
 51
51 -
 52
52 -
 53
53 -
 54
54 -
 55
55 -
 56
56 -
 57
57 -
 58
58 -
59
-
60
-
61
-
62
-
63
-
64
-
65
-
66
-
67
-
68
-
69
-
70
-
71
-
72
-
73
-
74
-
75
-
76
-
77
-
78
-
79
-
80
-
81
-
82
-
83
-
84
-
85
-
86
-
87
-
88
-
89
-
90
-
91
-
92
-
93
-
94
-
95
-
96
 |
 |

45
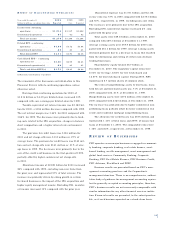
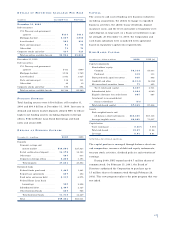
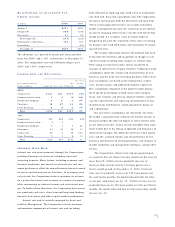
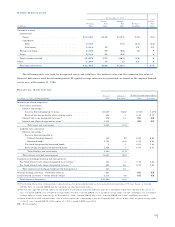
As a result of the sale of the credit card business and
exiting or downsizing certain non-strategic lending busi-
nesses, average loans decreased $2.8 billion and represent-
ed 84% of average earning assets for 2000 compared with
86% for the prior year. Average loans held for sale
increased $1.1 billion in the year-to-year comparison,
reflecting the decisions to exit certain non-strategic lending
businesses and to sell student loans in repayment.
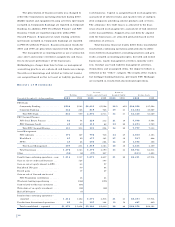
Funding cost is affected by the volume and composi-
tion of funding sources as well as related rates paid thereon.
Average deposits comprised 66% and 65% of total sources
of funds for 2000 and 1999, respectively, with the remain-
der primarily comprised of wholesale funding obtained at
prevailing market rates.
Average demand and money market deposits increased
$1.8 billion or 11% to $18.7 billion for 2000, primarily
reflecting the impact of strategic marketing initiatives to
grow more valuable transaction accounts, while other time
deposits decreased in the period-to-period comparison.
Average borrowed funds for 2000 decreased $1.7 billion
compared with 1999 as lower bank notes and Federal Home
Loan Bank borrowings more than offset increases in federal
funds purchased, subordinated debt and other borrowed
funds. The overall decrease in average borrowed funds was
primarily due to the combined impact of deposit growth and
a stable level of total assets.
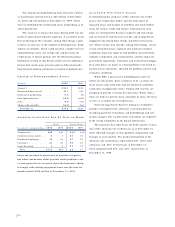
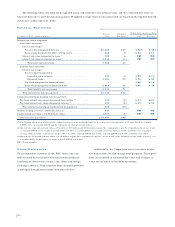
PR O V I S I O N FO R CR E D I T LO S S E S
The provision for credit losses was $136 million for 2000
compared with $163 million for 1999. Net charge-offs were
$135 million or .27% of average loans for 2000 compared
with $161 million or .31% , respectively, for 1999. The
decreases were primarily due to the sale of the credit card
business in the first quarter of 1999, partially offset by
higher commercial net charge-offs in 2000. PNC’s provision
for credit losses fully covered net charge-offs in both years.
See Credit Risk in the Risk Management section of this
Financial Review for additional information regarding
credit risk.
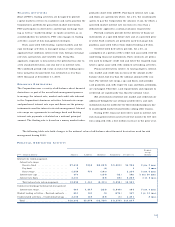
NO N I N T E R E S T IN C O M E
Noninterest income was $2.891 billion for 2000 and repre-
sented 57% of total revenue. On a comparable basis, nonin-
terest income increased $640 million or 28% compared
with full year 1999, excluding the non-core items that are
detailed in the 1999 Versus 1998 section of this Financial
Review. The increase was primarily driven by growth in cer-
tain fee-based businesses, the benefit of the ISG acquisition
and higher equity management income. Excluding ISG,
noninterest income increased 13% compared with the
prior year.
Asset management fees of $809 million for 2000
increased $128 million or 19% primarily driven by new
business. Assets under management were $253 billion at
December 31, 2000, a 19% increase compared with
December 31, 1999. Fund servicing fees were $654 million
for 2000, a $403 million increase compared with the prior
year primarily driven by the ISG acquisition. Excluding
ISG, fund servicing fees increased 22% mainly due to
existing and new client growth.
Brokerage fees of $249 million for 2000 increased
$30 million or 14% reflecting the continued expansion of
Hilliard Lyons’ distribution network. Consumer services
revenue of $209 million for 2000 increased 7% compared
with the prior year, excluding credit card fees. The increase
was primarily due to higher consumer transaction volume.
Corporate services revenue of $342 million for 2000
increased 7% compared with the prior year, excluding the
impact of valuation adjustments in 1999. The increase was
primarily driven by higher treasury management and
commercial mortgage servicing fees that were partially
offset by a lower level of commercial mortgage-backed
securitization gains.
Equity management income was $133 million for
2000 compared with $100 million in the prior year.
Equity investments are carried at estimated fair value and,
accordingly, revenue related to these investments may be
affected by market volatility. While equity management
income was strong in the first half of 2000, weak capital
markets caused the second half to be near break even.
Net securities gains were $20 million for 2000 com-
pared with $22 million for 1999. The net securities gains in
1999 included a $41 million gain from the sale of Concord
EFS, Inc. (“Concord”) stock that was partially offset by a
$28 million write-down of an equity investment.
Sale of subsidiary stock of $64 million in 1999 reflect-
ed the gain from the BlackRock IPO.
Other noninterest income of $269 million for 2000
increased $24 million or 10% compared with the prior year
excluding non-core items, primarily due to growth in cus-
tomer derivative and foreign exchange activity.