PNC Bank 2000 Annual Report Download - page 72
Download and view the complete annual report
Please find page 72 of the 2000 PNC Bank annual report below. You can navigate through the pages in the report by either clicking on the pages listed below, or by using the keyword search tool below to find specific information within the annual report.-
 1
1 -
2
-
3
-
4
-
5
-
6
-
7
-
8
-
9
-
10
-
11
-
12
-
13
-
14
-
15
-
16
-
17
-
18
-
19
-
20
-
21
-
22
-
23
-
24
-
25
-
26
-
27
-
28
-
29
-
30
-
31
-
32
-
33
-
34
-
35
-
36
-
37
-
38
-
39
-
40
-
41
-
42
-
43
-
44
-
45
-
46
-
47
-
48
-
49
-
50
-
51
-
52
-
53
-
54
-
55
-
56
-
57
-
58
-
59
-
60
-
61
-
 62
62 -
 63
63 -
 64
64 -
 65
65 -
 66
66 -
 67
67 -
 68
68 -
 69
69 -
 70
70 -
 71
71 -
 72
72 -
 73
73 -
 74
74 -
 75
75 -
 76
76 -
 77
77 -
 78
78 -
 79
79 -
 80
80 -
 81
81 -
 82
82 -
83
-
84
-
85
-
86
-
87
-
88
-
89
-
90
-
91
-
92
-
93
-
94
-
95
-
96
 |
 |

69
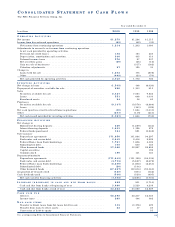
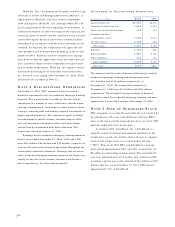
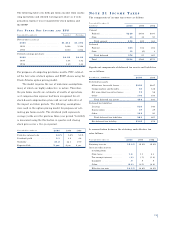
NO T E 4 CA S H FL O W S
For the statement of cash flows, cash and cash equivalents
are defined as cash and due from banks.
The following table sets forth information pertaining to
acquisitions and divestitures that affect cash flows:
Year ended December 31
In millions 2000 1999 1998
Assets acquired (divested) . . . . $4 $(2,062) $1,007
Liabilities acquired (divested) . . 4(208) (322)
Cash paid . . . . . . . . . . . . . . . . . 31 1,407 1,184
Cash and due from
banks received . . . . . . . . . . . 13,261 153
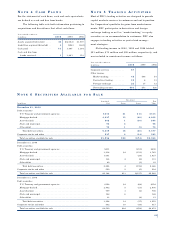
NO T E 5 T R A D I N G AC T I V I T I E S
Most of PNC’s trading activities are designed to provide
capital markets services to customers and not to position
the Corporation’s portfolio for gains from market move-
ments. PNC participates in derivatives and foreign
exchange trading as well as “market making” in equity
securities as an accommodation to customers. PNC also
engages in trading activities as part of risk manage-
ment strategies.
Net trading income in 2000, 1999 and 1998 totaled
$91 million, $73 million and $26 million, respectively, and
was included in noninterest income as follows:
Year ended December 31
In millions 2000 1999 1998
Corporate services . . . . . . . . . . $7
Other income
Market making . . . . . . . . . . . 42 $48 $3
Derivatives trading . . . . . . . . 20 8 11
Foreign exchange . . . . . . . . . 22 17 12
Net trading income . . . . . . . . $91 $73 $26
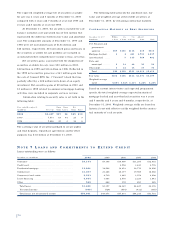
NO T E 6 SE C U R I T I E S AV A I L A B L E F O R SA L E
Amortized Unrealized Fair
In millions Cost Gains Losses Value
December 31, 2000
Debt securities
U.S. Treasury and government agencies . . . . . . . . . . . . . . . . . . . . . $313 $1 $(1) $313
Mortgage-backed. . . . . . . . . . . . . . . . . . . . . . . . . . . . . . . . . . . . . . 4,037 13 (48) 4,002
Asset-backed. . . . . . . . . . . . . . . . . . . . . . . . . . . . . . . . . . . . . . . . . 902 1 (10) 893
State and municipal. . . . . . . . . . . . . . . . . . . . . . . . . . . . . . . . . . . . 94 2 96
Other debt. . . . . . . . . . . . . . . . . . . . . . . . . . . . . . . . . . . . . . . . . . . 73 1 (1) 73
Total debt securities. . . . . . . . . . . . . . . . . . . . . . . . . . . . . . . . . . 5,419 18 (60) 5,377
Corporate stocks and other . . . . . . . . . . . . . . . . . . . . . . . . . . . . . . . . 537 2 (14) 525
Total securities available for sale . . . . . . . . . . . . . . . . . . . . . . . . . . $5,956 $20 $(74) $5,902
December 31, 1999
Debt securities
U.S. Treasury and government agencies . . . . . . . . . . . . . . . . . . . . . $411 $(11) $400
Mortgage-backed. . . . . . . . . . . . . . . . . . . . . . . . . . . . . . . . . . . . . . 3,918 $2 (151) 3,769
Asset-backed. . . . . . . . . . . . . . . . . . . . . . . . . . . . . . . . . . . . . . . . . 1,051 (24) 1,027
State and municipal. . . . . . . . . . . . . . . . . . . . . . . . . . . . . . . . . . . . 134 2 (5) 131
Other debt. . . . . . . . . . . . . . . . . . . . . . . . . . . . . . . . . . . . . . . . . . . 40 (1) 39
Total debt securities. . . . . . . . . . . . . . . . . . . . . . . . . . . . . . . . . . 5,554 4 (192) 5,366
Corporate stocks and other . . . . . . . . . . . . . . . . . . . . . . . . . . . . . . . . 590 9 (5) 594
Total securities available for sale . . . . . . . . . . . . . . . . . . . . . . . . . . $6,144 $13 $(197) $5,960
December 31, 1998
Debt securities
U.S. Treasury and government agencies . . . . . . . . . . . . . . . . . . . . . $152 $2 $(2) $152
Mortgage-backed. . . . . . . . . . . . . . . . . . . . . . . . . . . . . . . . . . . . . . 2,942 5 (11) 2,936
Asset-backed. . . . . . . . . . . . . . . . . . . . . . . . . . . . . . . . . . . . . . . . . 709 1 (2) 708
State and municipal. . . . . . . . . . . . . . . . . . . . . . . . . . . . . . . . . . . . 122 6 128
Other debt. . . . . . . . . . . . . . . . . . . . . . . . . . . . . . . . . . . . . . . . . . . 33 (2) 31
Total debt securities. . . . . . . . . . . . . . . . . . . . . . . . . . . . . . . . . . 3,958 14 (17) 3,955
Corporate stocks and other . . . . . . . . . . . . . . . . . . . . . . . . . . . . . . . . 542 10 (35) 517
Total securities available for sale . . . . . . . . . . . . . . . . . . . . . . . . . . $4,500 $24 $(52) $4,472