PNC Bank 2000 Annual Report Download - page 44
Download and view the complete annual report
Please find page 44 of the 2000 PNC Bank annual report below. You can navigate through the pages in the report by either clicking on the pages listed below, or by using the keyword search tool below to find specific information within the annual report.-
 1
1 -
2
-
3
-
4
-
5
-
6
-
7
-
8
-
9
-
10
-
11
-
12
-
13
-
14
-
15
-
16
-
17
-
18
-
19
-
20
-
21
-
22
-
23
-
24
-
25
-
26
-
27
-
28
-
29
-
30
-
31
-
32
-
33
-
 34
34 -
 35
35 -
 36
36 -
 37
37 -
 38
38 -
 39
39 -
 40
40 -
 41
41 -
 42
42 -
 43
43 -
 44
44 -
 45
45 -
 46
46 -
 47
47 -
 48
48 -
 49
49 -
 50
50 -
 51
51 -
 52
52 -
 53
53 -
 54
54 -
55
-
56
-
57
-
58
-
59
-
60
-
61
-
62
-
63
-
64
-
65
-
66
-
67
-
68
-
69
-
70
-
71
-
72
-
73
-
74
-
75
-
76
-
77
-
78
-
79
-
80
-
81
-
82
-
83
-
84
-
85
-
86
-
87
-
88
-
89
-
90
-
91
-
92
-
93
-
94
-
95
-
96
 |
 |

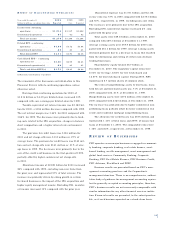
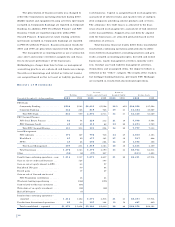
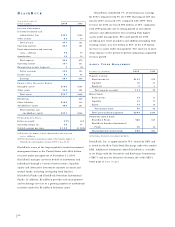
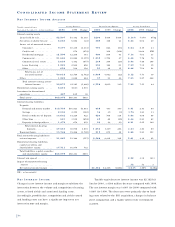
PN C A D V I S O R S
Year ended December 31
Dollars in millions 2000 1999
IN C O M E ST A T E M E N T
Net interest income . . . . . . . . . . . . . $136 $130
Noninterest income
Investment management and tru s t . 421 388
Brokerage . . . . . . . . . . . . . . . . . . 171 149
Other . . . . . . . . . . . . . . . . . . . . . 64 71
Total noninterest income . . . . . 656 608
Total revenue . . . . . . . . . . . . . . . 792 738
Provision for credit losses . . . . . . . . 57
Noninterest expense . . . . . . . . . . . . 511 494
Pretax earnings . . . . . . . . . . . . . . 276 237
Income taxes . . . . . . . . . . . . . . . . . . 103 90
Earnings . . . . . . . . . . . . . . . . . . . $173 $147
AV E R A G E BA L A N C E SH E E T
Loans
Residential mortgage . . . . . . . . . . $962 $959
Consumer . . . . . . . . . . . . . . . . . . 965 940
Commercial . . . . . . . . . . . . . . . . . 602 631
Other . . . . . . . . . . . . . . . . . . . . . 532 389
Total loans . . . . . . . . . . . . . . . . 3,061 2,919
Other assets . . . . . . . . . . . . . . . . . . 439 434
Total assets . . . . . . . . . . . . . . . . . $3,500 $3,353
Deposits . . . . . . . . . . . . . . . . . . . . $2,034 $2,164
Assigned funds and other liabilities . 917 641
Assigned capital . . . . . . . . . . . . . . . 549 548
Total funds . . . . . . . . . . . . . . . . . $3,500 $3,353
PE R F O R M A N C E RA T I O S
Return on assigned capital . . . . . . . 32% 27%
Noninterest income to total revenue . 83 82
Efficiency . . . . . . . . . . . . . . . . . . . . 64 66
PNC Advisors provides a full range of tailored investment
products and services to affluent individuals and families
including full-service brokerage through J.J.B. Hilliard,
W.L. Lyons, Inc. (“Hilliard Lyons”) and investment advisory
services to the ultra-affluent through Hawthorn. PNC
Advisors also serves as investment manager and trustee for
employee benefit plans and charitable and endowment
assets.
PNC Advisors strives to be the “financial advisor of
choice” in the growing high-net-worth market, providing a
full range of high-quality, customized and predominantly
fee-based investment products and services. PNC Advisors
continues to expand Hilliard Lyons throughout the
Corporation’s geographic region, which includes some of
the nation’s wealthiest metropolitan areas.
PNC Advisors contributed 14% of total business earn-
ings for 2000 compared with 13% for 1999. Earnings
of $173 million for 2000 increased $26 million or
18% compared with last year.
Revenue increased $54 million or 7% in the year-to-
year comparison despite the impact of weak equity market
conditions. The increase was primarily driven by growth in
brokerage revenue, resulting from the continued expansion
of Hilliard Lyons’ distribution network and strong invest-
ment management sales. Noninterest expense increased 3%
in the year-to-year comparison primarily due to effective
expense management initiatives that resulted in improved
operating efficiency.
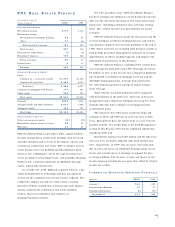
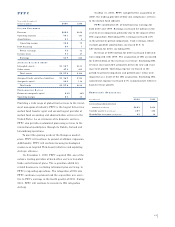
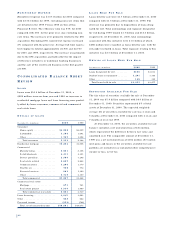
AS S E T S UN D E R MA N A G E M E N T (a)
Year ended December 31
December 31 – in billions 2000 1999 (b)
Personal investment management
and trust . . . . . . . . . . . . . . . . . . . $50 $52
Institutional tru s t . . . . . . . . . . . . . . . 15 14
Total . . . . . . . . . . . . . . . . . . . . . . $65 $66
(a) Assets under management do not include brokerage assets
administered.
(b) Restated to reflect the transfer of assets under management between
PNC businesses.
Personal assets under management decreased primarily due
to the equity component of customers’ portfolios. The weak
equity market in 2000 reduced assets under management by
approximately $3 billion. This decline was partially offset
by new customers’ assets added during the year as a result
of strong investment sales activity.
Brokerage assets administered by PNC Advisors
were $28 billion at December 31, 2000 compared with
$27 billion at December 31, 1999.
41