PNC Bank 2000 Annual Report Download - page 60
Download and view the complete annual report
Please find page 60 of the 2000 PNC Bank annual report below. You can navigate through the pages in the report by either clicking on the pages listed below, or by using the keyword search tool below to find specific information within the annual report.-
 1
1 -
2
-
3
-
4
-
5
-
6
-
7
-
8
-
9
-
10
-
11
-
12
-
13
-
14
-
15
-
16
-
17
-
18
-
19
-
20
-
21
-
22
-
23
-
24
-
25
-
26
-
27
-
28
-
29
-
30
-
31
-
32
-
33
-
34
-
35
-
36
-
37
-
38
-
39
-
40
-
41
-
42
-
43
-
44
-
45
-
46
-
47
-
48
-
49
-
 50
50 -
 51
51 -
 52
52 -
 53
53 -
 54
54 -
 55
55 -
 56
56 -
 57
57 -
 58
58 -
 59
59 -
 60
60 -
 61
61 -
 62
62 -
 63
63 -
 64
64 -
 65
65 -
 66
66 -
 67
67 -
 68
68 -
 69
69 -
 70
70 -
71
-
72
-
73
-
74
-
75
-
76
-
77
-
78
-
79
-
80
-
81
-
82
-
83
-
84
-
85
-
86
-
87
-
88
-
89
-
90
-
91
-
92
-
93
-
94
-
95
-
96
 |
 |

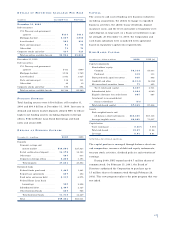
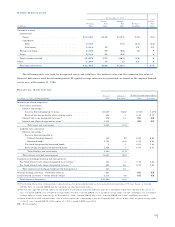
The decrease in corporate services revenue primarily
reflected the impact of $188 million of valuation adjust-
ments in 1999 associated with the exit of certain non-strate-
gic lending businesses. Excluding valuation adjustments in
both years, corporate services revenue was $321 million
and $275 million for 1999 and 1998, respectively, a 17%
increase primarily due to growth in commercial mortgage
banking, capital markets and treasury management fees.
Equity management income was $100 million for 1999
and $96 million for 1998. Both years benefited from strong
equity market conditions. Net securities gains for 1999 were
$22 million and included a $41 million gain from the sale
of Concord stock that was partially offset by a $28 million
write-down of an equity investment. Sale of subsidiary stock
of $64 million in 1999 reflected the gain from the
BlackRock IPO.
Other noninterest income included a $193 million gain
from the sale of the credit card business in the first quarter
of 1999. Also included in other noninterest income was a
$97 million gain from the sale of an equity interest in
Electronic Payment Services, Inc. (“EPS”), $27 million of
gains from the sale of retail branches and $7 million of val-
uation adjustments. During 1998, other noninterest income
included a $97 million gain from the sale of the corporate
trust business, $86 million of branch gains and a $21 mil-
lion loss from the sale of a credit card portfolio. Excluding
these items, other noninterest income increased $65 million
in the comparison primarily due to the Hilliard Lyons
acquisition.
NO N I N T E R E S T EX P E N S E
Noninterest expense was $2.843 billion for 1999 compared
with $2.698 billion in 1998. The increase was primarily to
support revenue growth in fee-based businesses. On a com-
parable basis, noninterest expense increased $81 million or
3% excluding $98 million of costs related to efficiency ini-
tiatives (compensation - $22 million, net occupancy - $35
million, equipment - $38 million and other - $3 million), a
$30 million contribution to the PNC Foundation and
$12 million of expense associated with the buyout of PNC’s
mall ATM marketing representative from 1999. For 1998,
$55 million of costs related to consumer banking initiatives
and $21 million of merger and acquisition integration costs
were excluded from the comparison. The efficiency ratio
was 55% for 1999 and 1998 reflecting a continued focus on
improving returns in traditional businesses. Average full-
time equivalent employees were relatively consistent in the
year-to-year comparison and totaled approximately 22,700
and 23,000 in 1999 and 1998, respectively.
CO N S O L I D AT E D BA L A N C E
SH E E T RE V I E W
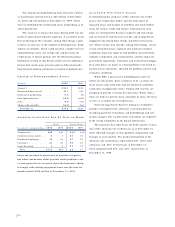
LO A N S
Loans were $49.7 billion at December 31, 1999, an $8.0
billion decrease from year-end 1998 primarily due to the
impact of strategies designed to reduce balance sheet
leverage in lower-return businesses.
SE C U R I T I E S AV A I L A B L E F O R SA L E
Securities available for sale increased $1.5 billion from
December 31, 1998, to $6.0 billion at December 31, 1999.
The expected weighted-average life of securities available
for sale increased to 4 years and 7 months at December 31,
1999, compared with 2 years and 8 months at year-end 1998.
FU N D I N G SO U R C E S
Total funding sources were $60.0 billion at December 31,
1999, a decrease of $2.1 billion compared with December
31, 1998 primarily resulting from reduced wholesale fund-
ing related to the credit card business that was sold in the
first quarter of 1999.
Total demand, savings and money market deposits
decreased approximately $190 million in the year-to-year
comparison as increases in money market deposits were
more than offset by decreases in time deposits, primarily
due to decreases in higher-rate certificates of deposit.
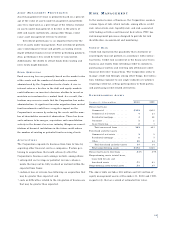
AS S E T QU A L I T Y
The ratio of nonperforming assets to total loans, loans held
for sale and foreclosed assets was .61% at December 31,
1999 and .55% at December 31, 1998. Nonperforming
assets were $325 million at December 31, 1999 compared
with $319 million at December 31, 1998. The allowance for
credit losses was $674 million and represented 232% of
nonaccrual loans and 1.36% of total loans at December 31,
1999. The comparable ratios were 263% and 1.31% ,
respectively, at December 31, 1998.
CA P I TA L
Shareholders’ equity totaled $5.9 billion and $6.0 billion at
December 31, 1999 and 1998, respectively, and the lever-
age ratio was 6.61% and 7.28% in the comparison. Tier I
and total risk-based capital ratios were 7.05% and 11.08% ,
respectively, at December 31, 1999, compared with 7.80%
and 11.16% , respectively, at December 31, 1998, computed
on a basis including discontinued operations.
57