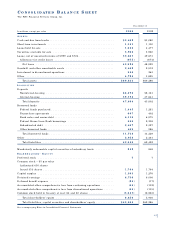
PNC Bank 2000 Annual Report Download - page 74
Download and view the complete annual report
Please find page 74 of the 2000 PNC Bank annual report below. You can navigate through the pages in the report by either clicking on the pages listed below, or by using the keyword search tool below to find specific information within the annual report.-
 1
1 -
2
-
3
-
4
-
5
-
6
-
7
-
8
-
9
-
10
-
11
-
12
-
13
-
14
-
15
-
16
-
17
-
18
-
19
-
20
-
21
-
22
-
23
-
24
-
25
-
26
-
27
-
28
-
29
-
30
-
31
-
32
-
33
-
34
-
35
-
36
-
37
-
38
-
39
-
40
-
41
-
42
-
43
-
44
-
45
-
46
-
47
-
48
-
49
-
50
-
51
-
52
-
53
-
54
-
55
-
56
-
57
-
58
-
59
-
60
-
61
-
62
-
63
-
 64
64 -
 65
65 -
 66
66 -
 67
67 -
 68
68 -
 69
69 -
 70
70 -
 71
71 -
 72
72 -
 73
73 -
 74
74 -
 75
75 -
 76
76 -
 77
77 -
 78
78 -
 79
79 -
 80
80 -
 81
81 -
 82
82 -
 83
83 -
 84
84 -
85
-
86
-
87
-
88
-
89
-
90
-
91
-
92
-
93
-
94
-
95
-
96
 |
 |

71
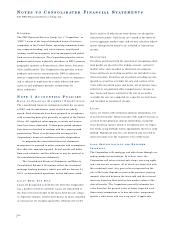
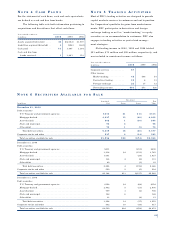
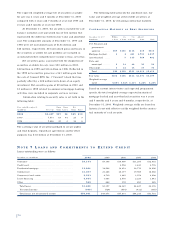
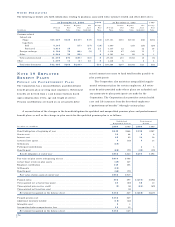
Loan outstandings and related unfunded commitments are
concentrated in PNC’s primary geographic markets. At
December 31, 2000, no specific industry concentration
exceeded 6.5% of total outstandings and unfunded commit-
ments.
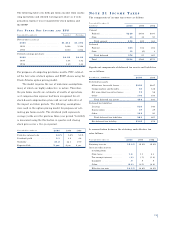
NE T UN F U N D E D CO M M I T M E N T S (a)
December 31 - in millions 2000 1999
Consumer . . . . . . . . . . . . . . . . . . . . . . . $4,414 $4,603
Commercial . . . . . . . . . . . . . . . . . . . . . 24,253 23,251
Commercial real estate . . . . . . . . . . . . . 1,039 740
Lease financing . . . . . . . . . . . . . . . . . . 123 136
Other . . . . . . . . . . . . . . . . . . . . . . . . . . 173 1,513
Total . . . . . . . . . . . . . . . . . . . . . . . . $30,002 $30,243
(a) Excludes unfunded commitments related to loans designated for exit.
Commitments to extend credit represent arrangements to
lend funds subject to specified contractual conditions.
Commercial commitments are reported net of participations,
assignments and syndications, primarily to financial institu-
tions, totaling $7.2 billion at December 31, 2000 and 1999.
Commitments generally have fixed expiration dates, may
require payment of a fee, and contain termination clauses in
the event the customer’s credit quality deteriorates. Based
on the Corporation’s historical experience, most commit-
ments expire unfunded, and therefore cash requirements are
substantially less than the total commitment.
Net outstanding letters of credit totaled $4.0 billion and
$4.6 billion at December 31, 2000 and 1999, respectively,
and consisted primarily of standby letters of credit that
commit the Corporation to make payments on behalf of cus-
tomers if certain specified future events occur. Such instru-
ments are typically issued to support industrial revenue
bonds, commercial paper, and bid-or-performance related
contracts. At year-end 2000, the largest industry concentra-
tion within standby letters of credit was for educational
services, which accounted for approximately 8% of the total.
Maturities for standby letters of credit ranged from 2001
to 2011.
Unfunded commitments and letters of credit related to
loans designated for exit in 1999 were $1.7 billion at
December 31, 2000 and $4.8 billion at December 31, 1999.
At December 31, 2000, $8.0 billion of loans were
pledged to secure borrowings and for other purposes.
Certain directors and executive officers of the
Corporation and its subsidiaries, as well as certain affiliated
companies of these directors and officers, were customers of
and had loans with subsidiary banks in the ordinary course
of business. All such loans were on substantially the same
terms, including interest rates and collateral, as those pre-
vailing at the time for comparable transactions with other
customers and did not involve more than a normal risk of
collectibility. The aggregate dollar amounts of these loans
were $29 million and $27 million at December 31, 2000
and 1999, respectively. During 2000, new loans of $16 mil-
lion were funded and repayments totaled $14 million.
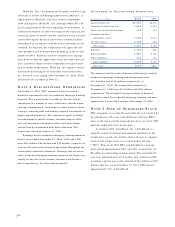
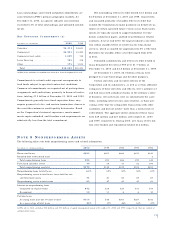
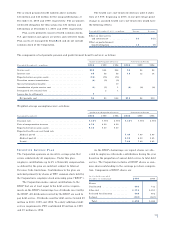
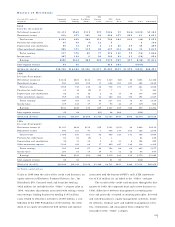
NO T E 8 NO N P E R F O R M I N G AS S E T S
The following table sets forth nonperforming assets and related information:
December 31 - dollars in millions 2000 1999 1998 1997 1996
Nonaccrual loans . . . . . . . . . . . . . . . . . . . . . . . . . . . . . . . $323 $291 $286 $270 $343
Troubled debt restructured loans . . . . . . . . . . . . . . . . . . . 2
Total nonperforming loans . . . . . . . . . . . . . . . . . . . . . . . 323 291 286 270 345
Foreclosed and other assets . . . . . . . . . . . . . . . . . . . . . . . 49 34 33 52 106
Total nonperforming assets (a) . . . . . . . . . . . . . . . . . . . . $372 $325 $319 $322 $451
Nonperforming loans to total loans . . . . . . . . . . . . . . . . . . .64% .59% .50% .50% .67%
Nonperforming assets to total loans, loans held for sale
and foreclosed assets . . . . . . . . . . . . . . . . . . . . . . . . . . .71 .61 .55 .59 .87
Nonperforming assets to total assets . . . . . . . . . . . . . . . . . .53 .47 .45 .45 .63
Interest on nonperforming loans
Computed on original terms . . . . . . . . . . . . . . . . . . . . . $42 $28 $25 $31 $34
Recognized . . . . . . . . . . . . . . . . . . . . . . . . . . . . . . . . . 10 11 6 6 10
Past due loans
Accruing loans past due 90 days or more . . . . . . . . . . . $113 $86 $263 $287 $242
As a percentage of total loans . . . . . . . . . . . . . . . . . . . . .22% .17% .46% .53% .47%
(a) The above table excludes $18 million and $13 million of equity management assets at December 31, 2000 and 1999, respectively, that are carried at
estimated fair value.