PNC Bank 2000 Annual Report Download - page 52
Download and view the complete annual report
Please find page 52 of the 2000 PNC Bank annual report below. You can navigate through the pages in the report by either clicking on the pages listed below, or by using the keyword search tool below to find specific information within the annual report.-
 1
1 -
2
-
3
-
4
-
5
-
6
-
7
-
8
-
9
-
10
-
11
-
12
-
13
-
14
-
15
-
16
-
17
-
18
-
19
-
20
-
21
-
22
-
23
-
24
-
25
-
26
-
27
-
28
-
29
-
30
-
31
-
32
-
33
-
34
-
35
-
36
-
37
-
38
-
39
-
40
-
41
-
 42
42 -
 43
43 -
 44
44 -
 45
45 -
 46
46 -
 47
47 -
 48
48 -
 49
49 -
 50
50 -
 51
51 -
 52
52 -
 53
53 -
 54
54 -
 55
55 -
 56
56 -
 57
57 -
 58
58 -
 59
59 -
 60
60 -
 61
61 -
 62
62 -
63
-
64
-
65
-
66
-
67
-
68
-
69
-
70
-
71
-
72
-
73
-
74
-
75
-
76
-
77
-
78
-
79
-
80
-
81
-
82
-
83
-
84
-
85
-
86
-
87
-
88
-
89
-
90
-
91
-
92
-
93
-
94
-
95
-
96
 |
 |

AS S E T MA N A G E M E N T PE R F O R M A N C E
Asset management revenue is primarily based on a percent-
age of the value of assets under management and perform-
ance fees expressed as a percentage of the returns realized
on assets under management. A decline in the prices of
debt and equity instruments, among other things, could
cause asset management revenue to decline.
Investment performance is an important factor for the
level of assets under management. Poor investment perform-
ance could impair revenue and growth as existing clients
might withdraw funds in favor of better performing products.
Also, performance fees could be lower or nonexistent.
Additionally, the ability to attract funds from existing and
new clients might diminish.
FU N D SE RV I C I N G
Fund servicing fees are primarily based on the market value
of the assets and the number of shareholder accounts
administered by the Corporation for its clients. A rise in
interest rates or a decline in the debt and equity markets
could influence an investor
’
s decision whether to invest or
maintain an investment in a mutual fund. As a result, fluc-
tuations may occur in assets that the Corporation has under
administration. A significant investor migration from mutual
fund investments could have a negative impact on the
Corporation’s revenues by reducing the assets and the num-
ber of shareholder accounts it administers. There has been
and continues to be merger, acquisition and consolidation
activity in the financial services industry. Mergers or cons o l-
idations of financial institutions in the future could re d u c e
the number of existing or potential fund servicing clients.
AC Q U I S I T I O N S
The Corporation expands its business from time to time by
acquiring other financial services companies. Factors per-
taining to acquisitions that could adversely affect the
Corporation’s business and earnings include, among others:
•anticipated cost savings or potential revenue enhance-
ments that may not be fully realized or realized within the
expected time frame;
•customer loss or revenue loss following an acquisition that
may be greater than expected; and
• costs or difficulties related to the integration of businesses
that may be greater than expected.
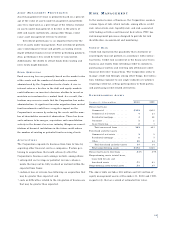
RI S K MA N A G E M E N T
In the normal course of business, the Corporation assumes
various types of risk, which include, among others, credit
risk, interest rate risk, liquidity risk, and risk associated
with trading activities and financial derivatives. PNC has
risk management processes designed to provide for risk
i d e n t i fication, measurement and monitoring.
CR E D I T RI S K
Credit risk represents the possibility that a borrower or
counterparty may not perform in accordance with contrac-
tual terms. Credit risk is inherent in the financial services
business and results from extending credit to customers,
purchasing securities and entering into off-balance-sheet
financial derivative transactions. The Corporation seeks to
manage credit risk through, among other things, diversifica-
tion, limiting exposure to any single industry or customer,
requiring collateral, selling participations to third parties,
and purchasing credit-related derivatives.
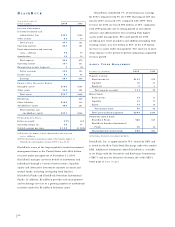
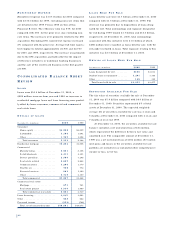
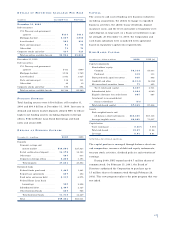
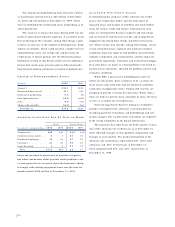
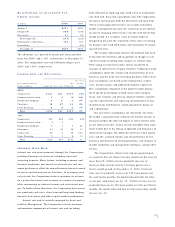
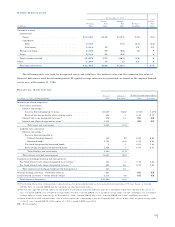
NO N P E R F O R M I N G AS S E T S
Year ended December 31
December 31 – dollars in millions 2 000 1999
Nonaccrual loans
Commercial . . . . . . . . . . . . . . . . . $312 $219
Commercial real estate . . . . . . . . 321
Residential mortgage . . . . . . . . . . 448
Consumer . . . . . . . . . . . . . . . . . . 22
Lease financing . . . . . . . . . . . . . . 21
Total nonaccrual loans . . . . . . . 323 291
Foreclosed and other assets
Commercial real estate . . . . . . . . 35
Residential mortgage . . . . . . . . . . 87
Other . . . . . . . . . . . . . . . . . . . . . 38 22
Total foreclosed and other assets 49 34
Total nonperforming assets . . . . . $372 $325
Nonaccrual loans to total loans . . . . .64% .59%
Nonperforming assets to total loans,
loans held for sale and
foreclosed assets . . . . . . . . . . . . . .71 .61
N o n p e r f o rming assets to total assets . . .53 .47
The above table excludes $18 million and $13 million of
equity management assets at December 31, 2000 and 1999,
respectively, that are carried at estimated fair value.
49