PNC Bank 2000 Annual Report Download - page 54
Download and view the complete annual report
Please find page 54 of the 2000 PNC Bank annual report below. You can navigate through the pages in the report by either clicking on the pages listed below, or by using the keyword search tool below to find specific information within the annual report.-
 1
1 -
2
-
3
-
4
-
5
-
6
-
7
-
8
-
9
-
10
-
11
-
12
-
13
-
14
-
15
-
16
-
17
-
18
-
19
-
20
-
21
-
22
-
23
-
24
-
25
-
26
-
27
-
28
-
29
-
30
-
31
-
32
-
33
-
34
-
35
-
36
-
37
-
38
-
39
-
40
-
41
-
42
-
43
-
 44
44 -
 45
45 -
 46
46 -
 47
47 -
 48
48 -
 49
49 -
 50
50 -
 51
51 -
 52
52 -
 53
53 -
 54
54 -
 55
55 -
 56
56 -
 57
57 -
 58
58 -
 59
59 -
 60
60 -
 61
61 -
 62
62 -
 63
63 -
 64
64 -
65
-
66
-
67
-
68
-
69
-
70
-
71
-
72
-
73
-
74
-
75
-
76
-
77
-
78
-
79
-
80
-
81
-
82
-
83
-
84
-
85
-
86
-
87
-
88
-
89
-
90
-
91
-
92
-
93
-
94
-
95
-
96
 |
 |

51
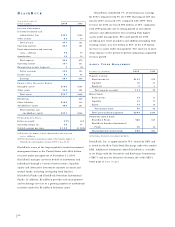
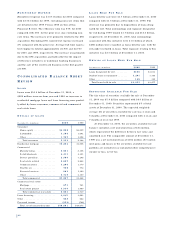
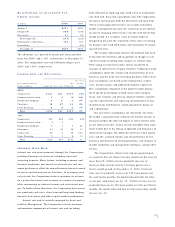
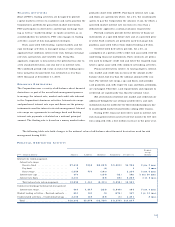
RO L L F O R W A R D O F AL L O WA N C E F O R
CR E D I T LO S S E S
Year ended December 31
In millions 2000 1999
January 1 . . . . . . . . . . . . . . . . . . . . $674 $753
Charge-offs . . . . . . . . . . . . . . . . . . . (186) (216)
Recoveries . . . . . . . . . . . . . . . . . . . 51 55
Net charge-offs . . . . . . . . . . . . . . (135) (161)
Provision for credit losses . . . . . . . . 136 163
Divestitures . . . . . . . . . . . . . . . . . . (81)
December 31 . . . . . . . . . . . . . . . $675 $674
The allowance as a percent of nonaccrual loans and total
loans was 209% and 1.33% , respectively, at December 31,
2000. The comparable year-end 1999 percentages were
232% and 1.36% , respectively.
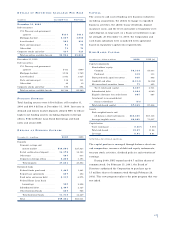
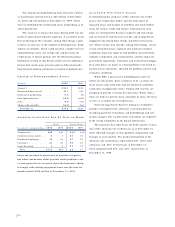
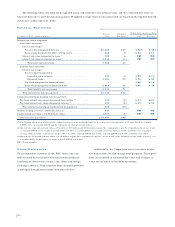
CH A R G E - O F F S A N D RE C O V E R I E S
Percent of
Year ended December 31 Net Average
Dollars in millions Charge-offs Recoveries Charge-offs Loans
2000
Commercial . . . . . . . . . . $121 $21 $100 .46%
Commercial real estate . . 3 4 (1) (.04)
Residential mortgage . . . 8 2 6 .05
Consumer . . . . . . . . . . . . 46 22 24 .26
Lease financing . . . . . . . 8 2 6 .19
Total . . . . . . . . . . . . . . $186 $51 $135 .27
1999
Commercial . . . . . . . . . . $72 $22 $50 .22%
Commercial real estate . . 4 4
Residential mortgage . . . 8 1 7 .06
Consumer . . . . . . . . . . . . 63 25 38 .37
Credit card . . . . . . . . . . . 60 2 58 8.63
Lease financing . . . . . . . 9 1 8 .31
Total . . . . . . . . . . . . . . $216 $55 $161 .31
IN T E R E S T RA T E RI S K
Interest rate risk arises primarily through the Corporation’s
traditional business activities of extending loans and
accepting deposits. Many factors, including economic and
financial conditions, movements in interest rates and con-
sumer preferences affect the spread between interest earned
on assets and interest paid on liabilities. In managing inter-
est rate risk, the Corporation seeks to minimize its reliance
on a particular interest rate scenario as a source of earnings
while maximizing net interest income and net interest mar-
gin. To further these objectives, the Corporation uses securi-
ties purchases and sales, short-term and long-term funding,
financial derivatives and other capital markets instruments.
Interest rate risk is centrally managed by Asset and
Liability Management. The Corporation actively measures
and monitors components of interest rate risk including
term structure or repricing risk, yield curve or nonparallel
rate shift risk, basis risk and options risk. The Corporation
measures and manages both the short-term and long-term
effects of changing interest rates. An income simulation
model is designed to measure the sensitivity of net interest
income to changing interest rates over the next twenty-four
month period. An economic value of equity model is
designed to measure the sensitivity of the value of existing
on-balance-sheet and off-balance-sheet positions to chang-
ing interest rates.
The income simulation model is the primary tool used
to measure the direction and magnitude of changes in net
interest income resulting from changes in interest rates.
Forecasting net interest income and its sensitivity to
changes in interest rates requires that the Corporation make
assumptions about the volume and characteristics of new
business and the behavior of existing positions. These busi-
ness assumptions are based on the Corporation’s experi-
ence, business plans and published industry experience.
Key assumptions employed in the model include prepay-
ment speeds on mortgage-related assets and consumer
loans, loan volumes and pricing, deposit volumes and pric-
ing, the expected life and repricing characteristics of non-
maturity loans and deposits, and management’s financial
and capital plans.
Because these assumptions are inherently uncertain,
the model cannot precisely estimate net interest income or
precisely predict the effect of higher or lower interest rates
on net interest income. Actual results will differ from simu-
lated results due to the timing, magnitude and frequency of
interest rate changes, the difference between actual experi-
ence and the assumed volume and characteristics of new
business and behavior of existing positions, and changes in
market conditions and management strategies, among other
factors.
The Corporation’s interest rate risk management poli-
cies provide that net interest income should not decrease by
more than 3% if interest rates gradually increase or
decrease from current rates by 100 basis points over a
twelve-month period. At December 31, 2000, if interest
rates were to gradually increase by 100 basis points over
the next twelve months, the model indicated that net inter-
est income would decrease by .3% . If interest rates were to
gradually decrease by 100 basis points over the next twelve
months, the model indicated that net interest income would
increase by .4%.