PNC Bank 2000 Annual Report Download - page 91
Download and view the complete annual report
Please find page 91 of the 2000 PNC Bank annual report below. You can navigate through the pages in the report by either clicking on the pages listed below, or by using the keyword search tool below to find specific information within the annual report.-
 1
1 -
2
-
3
-
4
-
5
-
6
-
7
-
8
-
9
-
10
-
11
-
12
-
13
-
14
-
15
-
16
-
17
-
18
-
19
-
20
-
21
-
22
-
23
-
24
-
25
-
26
-
27
-
28
-
29
-
30
-
31
-
32
-
33
-
34
-
35
-
36
-
37
-
38
-
39
-
40
-
41
-
42
-
43
-
44
-
45
-
46
-
47
-
48
-
49
-
50
-
51
-
52
-
53
-
54
-
55
-
56
-
57
-
58
-
59
-
60
-
61
-
62
-
63
-
64
-
65
-
66
-
67
-
68
-
69
-
70
-
71
-
72
-
73
-
74
-
75
-
76
-
77
-
78
-
79
-
80
-
 81
81 -
 82
82 -
 83
83 -
 84
84 -
 85
85 -
 86
86 -
 87
87 -
 88
88 -
 89
89 -
 90
90 -
 91
91 -
 92
92 -
 93
93 -
 94
94 -
 95
95 -
 96
96
 |
 |

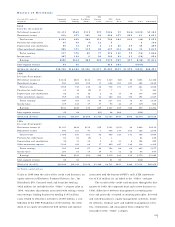
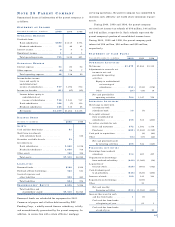
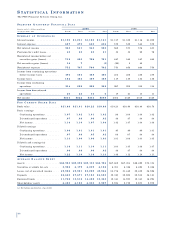
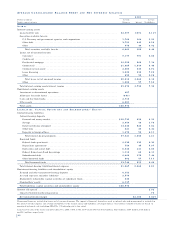
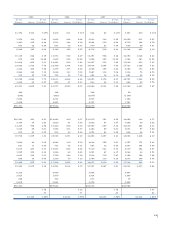
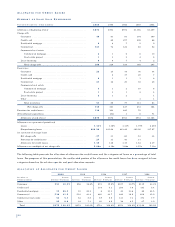
AV E R A G E CO N S O L I D AT E D BA L A N C E SH E E T A N D NE T IN T E R E S T AN A LY S I S
2000
Dollars in millions Average Average
Taxable-equivalent basis Balances Interest Yields/Rates
AS S E T S
Interest-earning assets
Loans held for sale . . . . . . . . . . . . . . . . . . . . . . . . . . . . . . . . . . . . . . . . . . . . . . . . . . . . . . . . . $2,507 $204 8.14%
Securities available for sale
U.S. Treasury and government agencies and corporations . . . . . . . . . . . . . . . . . . . . . . . . . . . 1,760 104 5.91
Other debt . . . . . . . . . . . . . . . . . . . . . . . . . . . . . . . . . . . . . . . . . . . . . . . . . . . . . . . . . . . . . 3,723 245 6.58
Other . . . . . . . . . . . . . . . . . . . . . . . . . . . . . . . . . . . . . . . . . . . . . . . . . . . . . . . . . . . . . . . . . 578 40 6.92
Total securities available for sale . . . . . . . . . . . . . . . . . . . . . . . . . . . . . . . . . . . . . . . . . . . 6,061 389 6.42
Loans, net of unearned income
Consumer . . . . . . . . . . . . . . . . . . . . . . . . . . . . . . . . . . . . . . . . . . . . . . . . . . . . . . . . . . . . . 9,177 791 8.62
Credit card . . . . . . . . . . . . . . . . . . . . . . . . . . . . . . . . . . . . . . . . . . . . . . . . . . . . . . . . . . . . .
Residential mortgage . . . . . . . . . . . . . . . . . . . . . . . . . . . . . . . . . . . . . . . . . . . . . . . . . . . . . 12,599 900 7.14
Commercial . . . . . . . . . . . . . . . . . . . . . . . . . . . . . . . . . . . . . . . . . . . . . . . . . . . . . . . . . . . . 21,685 1,839 8.48
Commercial real estate . . . . . . . . . . . . . . . . . . . . . . . . . . . . . . . . . . . . . . . . . . . . . . . . . . . . 2,685 240 8.94
Lease financing . . . . . . . . . . . . . . . . . . . . . . . . . . . . . . . . . . . . . . . . . . . . . . . . . . . . . . . . . . 3,222 235 7.29
Other . . . . . . . . . . . . . . . . . . . . . . . . . . . . . . . . . . . . . . . . . . . . . . . . . . . . . . . . . . . . . . . . . 650 55 8.46
Total loans, net of unearned income . . . . . . . . . . . . . . . . . . . . . . . . . . . . . . . . . . . . . . . . . 50,018 4,060 8.12
Other . . . . . . . . . . . . . . . . . . . . . . . . . . . . . . . . . . . . . . . . . . . . . . . . . . . . . . . . . . . . . . . . . 1,289 97 7.53
Total interest-earning assets/interest income . . . . . . . . . . . . . . . . . . . . . . . . . . . . . . . . . . . . . . 59,875 4,750 7.93
Noninterest-earning assets
Investment in discontinued operations . . . . . . . . . . . . . . . . . . . . . . . . . . . . . . . . . . . . . . . . . . . 487
Allowance for credit losses . . . . . . . . . . . . . . . . . . . . . . . . . . . . . . . . . . . . . . . . . . . . . . . . . . . (683)
Cash and due from banks . . . . . . . . . . . . . . . . . . . . . . . . . . . . . . . . . . . . . . . . . . . . . . . . . . . . 2,718
Other assets . . . . . . . . . . . . . . . . . . . . . . . . . . . . . . . . . . . . . . . . . . . . . . . . . . . . . . . . . . . . . . 6,581
Total assets . . . . . . . . . . . . . . . . . . . . . . . . . . . . . . . . . . . . . . . . . . . . . . . . . . . . . . . . . . . . . . . $68,978
LI A B I L I T I E S , C A P I TA L SE C U R I T I E S A N D SH A R E H O L D E R S ’ EQ U I T Y
Interest-bearing liabilities
Interest-bearing deposits
Demand and money market . . . . . . . . . . . . . . . . . . . . . . . . . . . . . . . . . . . . . . . . . . . . . . . . . $18,735 658 3.51
Savings . . . . . . . . . . . . . . . . . . . . . . . . . . . . . . . . . . . . . . . . . . . . . . . . . . . . . . . . . . . . . . . . 2,050 36 1.76
Retail certificates of deposit . . . . . . . . . . . . . . . . . . . . . . . . . . . . . . . . . . . . . . . . . . . . . . . . 14,642 826 5.64
Other time . . . . . . . . . . . . . . . . . . . . . . . . . . . . . . . . . . . . . . . . . . . . . . . . . . . . . . . . . . . . . 621 40 6.44
Deposits in foreign offices . . . . . . . . . . . . . . . . . . . . . . . . . . . . . . . . . . . . . . . . . . . . . . . . . . 1,473 93 6.31
Total interest-bearing deposits . . . . . . . . . . . . . . . . . . . . . . . . . . . . . . . . . . . . . . . . . . . . . 37,521 1,653 4.41
Borrowed funds
Federal funds purchased . . . . . . . . . . . . . . . . . . . . . . . . . . . . . . . . . . . . . . . . . . . . . . . . . . . 2,139 135 6.31
Repurchase agreements . . . . . . . . . . . . . . . . . . . . . . . . . . . . . . . . . . . . . . . . . . . . . . . . . . . 754 45 5.97
Bank notes and senior debt . . . . . . . . . . . . . . . . . . . . . . . . . . . . . . . . . . . . . . . . . . . . . . . . . 6,532 431 6.60
Federal Home Loan Bank borrowings . . . . . . . . . . . . . . . . . . . . . . . . . . . . . . . . . . . . . . . . . 1,113 68 6.11
Subordinated debt . . . . . . . . . . . . . . . . . . . . . . . . . . . . . . . . . . . . . . . . . . . . . . . . . . . . . . . . 2,406 179 7.44
Other borrowed funds . . . . . . . . . . . . . . . . . . . . . . . . . . . . . . . . . . . . . . . . . . . . . . . . . . . . . 802 57 7.11
Total borrowed funds . . . . . . . . . . . . . . . . . . . . . . . . . . . . . . . . . . . . . . . . . . . . . . . . . . . . 13,746 915 6.66
Total interest-bearing liabilities/interest expense . . . . . . . . . . . . . . . . . . . . . . . . . . . . . . . . . . . 51,267 2,568 5.01
Noninterest-bearing liabilities and shareholders’ equity
Demand and other noninterest-bearing deposits . . . . . . . . . . . . . . . . . . . . . . . . . . . . . . . . . . . . 8,151
Accrued expenses and other liabilities . . . . . . . . . . . . . . . . . . . . . . . . . . . . . . . . . . . . . . . . . . 2,575
Mandatorily redeemable capital securities of subsidiary trusts . . . . . . . . . . . . . . . . . . . . . . . . . 848
Shareholders’ equity . . . . . . . . . . . . . . . . . . . . . . . . . . . . . . . . . . . . . . . . . . . . . . . . . . . . . . . . 6,137
Total liabilities, capital securities and shareholders’ equity . . . . . . . . . . . . . . . . . . . . . . . . . . . $68,978
Interest rate spread . . . . . . . . . . . . . . . . . . . . . . . . . . . . . . . . . . . . . . . . . . . . . . . . . . . . . . . . . . . 2.92
Impact of noninterest-bearing sources . . . . . . . . . . . . . . . . . . . . . . . . . . . . . . . . . . . . . . . . . . . .72
Net interest income/margin . . . . . . . . . . . . . . . . . . . . . . . . . . . . . . . . . . . . . . . . . . . . . . . . . . $2,182 3.64%
Nonaccrual loans are included in loans, net of unearned income. The impact of financial derivatives used in interest rate risk management is included in
the interest income/expense and average yields/rates of the related assets and liabilities. Average balances of securities available for sale are based on
amortized historical cost (excluding SFAS No. 115 adjustments to fair value).
Loan fees for each of the years ended December 31, 2000, 1999, 1998, 1997 and 1996 were $115 million, $120 million, $107 million, $89 million
and $93 million, respectively.
88