PNC Bank 2000 Annual Report Download - page 58
Download and view the complete annual report
Please find page 58 of the 2000 PNC Bank annual report below. You can navigate through the pages in the report by either clicking on the pages listed below, or by using the keyword search tool below to find specific information within the annual report.-
 1
1 -
2
-
3
-
4
-
5
-
6
-
7
-
8
-
9
-
10
-
11
-
12
-
13
-
14
-
15
-
16
-
17
-
18
-
19
-
20
-
21
-
22
-
23
-
24
-
25
-
26
-
27
-
28
-
29
-
30
-
31
-
32
-
33
-
34
-
35
-
36
-
37
-
38
-
39
-
40
-
41
-
42
-
43
-
44
-
45
-
46
-
47
-
 48
48 -
 49
49 -
 50
50 -
 51
51 -
 52
52 -
 53
53 -
 54
54 -
 55
55 -
 56
56 -
 57
57 -
 58
58 -
 59
59 -
 60
60 -
 61
61 -
 62
62 -
 63
63 -
 64
64 -
 65
65 -
 66
66 -
 67
67 -
 68
68 -
69
-
70
-
71
-
72
-
73
-
74
-
75
-
76
-
77
-
78
-
79
-
80
-
81
-
82
-
83
-
84
-
85
-
86
-
87
-
88
-
89
-
90
-
91
-
92
-
93
-
94
-
95
-
96
 |
 |

55
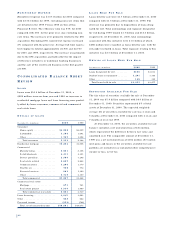
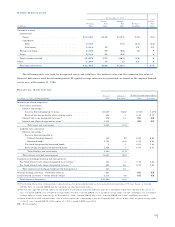
OT H E R DE R I VA T I V E S
At December 31, 2000 2000
Positive Negative Average
Notional Fair Fair Net Asset Fair
In millions Value Value Value (Liability) Value
Customer-related
Interest rate
Swaps . . . . . . . . . . . . . . . . . . . . . . . . . . . . . . . . . . . $13,567 $120 $(127) $(7) $(1)
Caps/floors
Sold. . . . . . . . . . . . . . . . . . . . . . . . . . . . . . . . . . . 5,145 (17) (17) (23)
Purchased . . . . . . . . . . . . . . . . . . . . . . . . . . . . . . 3,914 15 15 21
Foreign exchange. . . . . . . . . . . . . . . . . . . . . . . . . . . . . 6,108 79 (82) (3) 7
Other . . . . . . . . . . . . . . . . . . . . . . . . . . . . . . . . . . . . 2,544 59 (59) 4
Total customer-related . . . . . . . . . . . . . . . . . . . . . . . . . 31,278 273 (285) (12) 8
Other . . . . . . . . . . . . . . . . . . . . . . . . . . . . . . . . . . . . 1,207 13 (1) 12 8
Total other derivatives . . . . . . . . . . . . . . . . . . . . . . . . . $32,485 $286 $(286) $16
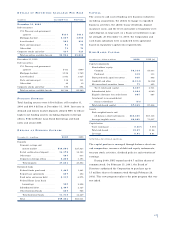
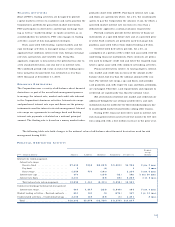
The following table sets forth, by designated assets and liabilities, the notional value and the estimated fair value of
financial derivatives used for risk management. Weighted-average interest rates presented are based on the implied forward
yield curve at December 31, 1999.
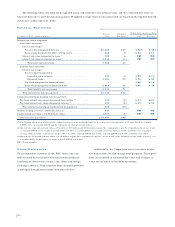
FI N A N C I A L DE R I V A T I V E S
Notional Estimated Weighted-Average Interest Rates
December 31, 1999 - dollars in millions Value Fair Value Paid Received
Interest rate risk management
Asset rate conversion
Interest rate swaps (1)
Receive fixed designated to loans. . . . . . . . . . . . . . . . . . . . . . $5,550 $(48) 6.53% 5.49%
Basis swaps designated to other earning assets . . . . . . . . . . . . 226 3 6.44 6.72
Interest rate caps designated to loans (2) . . . . . . . . . . . . . . . . . . . 474 12 NM NM
Interest rate floors designated to loans (3) . . . . . . . . . . . . . . . . . . . 3,311 NM NM
Total asset rate conversion . . . . . . . . . . . . . . . . . . . . . . . . . 9,561 (33)
Liability rate conversion
Interest rate swaps (1)
Receive fixed designated to:
Interest-bearing deposits . . . . . . . . . . . . . . . . . . . . . . . . . . 150 (2) 6.85 6.65
Borrowed funds . . . . . . . . . . . . . . . . . . . . . . . . . . . . . . . . . 1,713 (23) 6.75 6.24
Pay fixed designated to borrowed funds . . . . . . . . . . . . . . . . . 5 1 6.09 7.04
Basis swaps designated to borrowed funds . . . . . . . . . . . . . . . 1,424 7 6.70 6.71
Total liability rate conversion . . . . . . . . . . . . . . . . . . . . . . . 3,292 (17)
Total interest rate risk management . . . . . . . . . . . . . . . . . . . . . . 12,853 (50)
Commercial mortgage banking risk management
Pay fixed interest rate swaps designated to securities (1) . . . . . . . . . 144 3 7.16 6.08
Pay fixed interest rate swaps designated to loans (1) . . . . . . . . . . . . . 499 48 5.49 7.05
Total commercial mortgage banking risk management. . . . . . . . . 643 51
Student lending activities – Forward contracts . . . . . . . . . . . . . . . . . . 681 NM NM
Credit-related activities – Credit default swaps . . . . . . . . . . . . . . . . . 4,315 (4) NM NM
Total financial derivatives . . . . . . . . . . . . . . . . . . . . . . . . . . . . . . . $18,492 $(3)
(1) The floating rate portion of interest rate contracts is based on money-market indices. As a percent of notional value, 27% were based on 1-month
LIBOR, 70% on 3-month LIBOR and the remainder on other short-term indices.
(2) Interest rate caps with notional values of $142 million, $129 million and $199 million require the counterparty to pay the Corporation the excess, if
any, of 3-month LIBOR over a weighted-average strike of 6.16%, 1-month LIBOR over a weighted-average strike of 5.72% and Prime over a weighted-
average strike of 8.76% , respectively. At December 31, 1999, 3-month LIBOR was 6.00% , 1-month LIBOR was 5.82% and Prime was 8.50%.
(3) Interest rate floors with notional values of $3.0 billion require the counterparty to pay the Corporation the excess, if any, of the weighted-average strike
of 4.63% over 3-month LIBOR. At December 31, 1999, 3-month LIBOR was 6.00% .
NM – Not meaningful