PNC Bank 2000 Annual Report Download - page 64
Download and view the complete annual report
Please find page 64 of the 2000 PNC Bank annual report below. You can navigate through the pages in the report by either clicking on the pages listed below, or by using the keyword search tool below to find specific information within the annual report.-
 1
1 -
2
-
3
-
4
-
5
-
6
-
7
-
8
-
9
-
10
-
11
-
12
-
13
-
14
-
15
-
16
-
17
-
18
-
19
-
20
-
21
-
22
-
23
-
24
-
25
-
26
-
27
-
28
-
29
-
30
-
31
-
32
-
33
-
34
-
35
-
36
-
37
-
38
-
39
-
40
-
41
-
42
-
43
-
44
-
45
-
46
-
47
-
48
-
49
-
50
-
51
-
52
-
53
-
 54
54 -
 55
55 -
 56
56 -
 57
57 -
 58
58 -
 59
59 -
 60
60 -
 61
61 -
 62
62 -
 63
63 -
 64
64 -
 65
65 -
 66
66 -
 67
67 -
 68
68 -
 69
69 -
 70
70 -
 71
71 -
 72
72 -
 73
73 -
 74
74 -
75
-
76
-
77
-
78
-
79
-
80
-
81
-
82
-
83
-
84
-
85
-
86
-
87
-
88
-
89
-
90
-
91
-
92
-
93
-
94
-
95
-
96
 |
 |

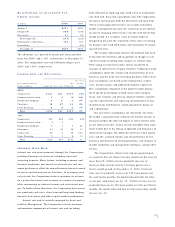
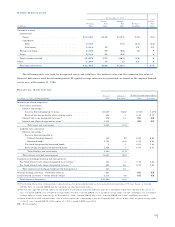
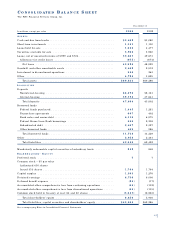
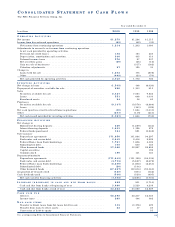
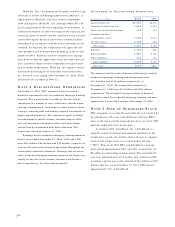
CO N S O L I D AT E D BA L A N C E SH E E T
The PNC Financial Services Group, Inc.
In millions, except par value 2000 1999
AS S E T S
Cash and due from banks . . . . . . . . . . . . . . . . . . . . . . . . . . . . . . . . . . . . . . . $3,662 $3,080
Short-term investments . . . . . . . . . . . . . . . . . . . . . . . . . . . . . . . . . . . . . . . . 1,151 1,100
Loans held for sale . . . . . . . . . . . . . . . . . . . . . . . . . . . . . . . . . . . . . . . . . . . 1,655 3,477
Securities available for sale . . . . . . . . . . . . . . . . . . . . . . . . . . . . . . . . . . . . . 5,902 5,960
Loans, net of unearned income of $999 and $724 . . . . . . . . . . . . . . . . . . . . . 50,601 49,673
Allowance for credit losses . . . . . . . . . . . . . . . . . . . . . . . . . . . . . . . . . . . . (675) (674)
Net loans . . . . . . . . . . . . . . . . . . . . . . . . . . . . . . . . . . . . . . . . . . . . . . . 49,926 48,999
Goodwill and other amortizable assets . . . . . . . . . . . . . . . . . . . . . . . . . . . . . 2,468 2,512
Investment in discontinued operations . . . . . . . . . . . . . . . . . . . . . . . . . . . . . 356 263
Other . . . . . . . . . . . . . . . . . . . . . . . . . . . . . . . . . . . . . . . . . . . . . . . . . . . . . 4,724 3,895
Total assets . . . . . . . . . . . . . . . . . . . . . . . . . . . . . . . . . . . . . . . . . . . . . . $69,844 $69,286
LI A B I L I T I E S
Deposits
Noninterest-bearing . . . . . . . . . . . . . . . . . . . . . . . . . . . . . . . . . . . . . . . . . $8,490 $8,161
Interest-bearing . . . . . . . . . . . . . . . . . . . . . . . . . . . . . . . . . . . . . . . . . . . . 39,174 37,641
Total deposits . . . . . . . . . . . . . . . . . . . . . . . . . . . . . . . . . . . . . . . . . . . . 47,664 45,802
Borrowed funds
Federal funds purchased . . . . . . . . . . . . . . . . . . . . . . . . . . . . . . . . . . . . . . 1,445 1,281
Repurchase agreements . . . . . . . . . . . . . . . . . . . . . . . . . . . . . . . . . . . . . . 607 402
Bank notes and senior debt . . . . . . . . . . . . . . . . . . . . . . . . . . . . . . . . . . . . 6,110 6,975
Federal Home Loan Bank borrowings . . . . . . . . . . . . . . . . . . . . . . . . . . . . 500 2,258
Subordinated debt . . . . . . . . . . . . . . . . . . . . . . . . . . . . . . . . . . . . . . . . . . 2,407 2,327
Other borrowed funds . . . . . . . . . . . . . . . . . . . . . . . . . . . . . . . . . . . . . . . . 649 986
Total borrowed funds . . . . . . . . . . . . . . . . . . . . . . . . . . . . . . . . . . . . . . . 11,718 14,229
Other . . . . . . . . . . . . . . . . . . . . . . . . . . . . . . . . . . . . . . . . . . . . . . . . . . . . . 2,958 2,461
Total liabilities . . . . . . . . . . . . . . . . . . . . . . . . . . . . . . . . . . . . . . . . . . . 62,340 62,492
Mandatorily redeemable capital securities of subsidiary trusts . . . . . . . . . . . 848 848
SH A R E H O L D E R S’ EQ U I T Y
Preferred stock . . . . . . . . . . . . . . . . . . . . . . . . . . . . . . . . . . . . . . . . . . . . . . 77
Common stock – $5 par value
Authorized 450 shares
Issued 353 shares . . . . . . . . . . . . . . . . . . . . . . . . . . . . . . . . . . . . . . . . . . . 1,764 1,764
Capital surplus . . . . . . . . . . . . . . . . . . . . . . . . . . . . . . . . . . . . . . . . . . . . . . 1,303 1,276
Retained earnings . . . . . . . . . . . . . . . . . . . . . . . . . . . . . . . . . . . . . . . . . . . . 6,736 6,006
Deferred benefit expense . . . . . . . . . . . . . . . . . . . . . . . . . . . . . . . . . . . . . . . (25) (17)
Accumulated other comprehensive loss from continuing operations . . . . . . . . (43) (132)
Accumulated other comprehensive loss from discontinued operations . . . . . . (45) (135)
Common stock held in treasury at cost: 63 and 60 shares . . . . . . . . . . . . . . . (3,041) (2,823)
Total shareholders’ equity . . . . . . . . . . . . . . . . . . . . . . . . . . . . . . . . . . . 6,656 5,946
Total liabilities, capital securities and shareholders’ equity . . . . . . . . . . . $69,844 $69,286
See accompanying Notes to Consolidated Financial Statements.
December 31
61