PNC Bank 2000 Annual Report Download - page 82
Download and view the complete annual report
Please find page 82 of the 2000 PNC Bank annual report below. You can navigate through the pages in the report by either clicking on the pages listed below, or by using the keyword search tool below to find specific information within the annual report.-
 1
1 -
2
-
3
-
4
-
5
-
6
-
7
-
8
-
9
-
10
-
11
-
12
-
13
-
14
-
15
-
16
-
17
-
18
-
19
-
20
-
21
-
22
-
23
-
24
-
25
-
26
-
27
-
28
-
29
-
30
-
31
-
32
-
33
-
34
-
35
-
36
-
37
-
38
-
39
-
40
-
41
-
42
-
43
-
44
-
45
-
46
-
47
-
48
-
49
-
50
-
51
-
52
-
53
-
54
-
55
-
56
-
57
-
58
-
59
-
60
-
61
-
62
-
63
-
64
-
65
-
66
-
67
-
68
-
69
-
70
-
71
-
 72
72 -
 73
73 -
 74
74 -
 75
75 -
 76
76 -
 77
77 -
 78
78 -
 79
79 -
 80
80 -
 81
81 -
 82
82 -
 83
83 -
 84
84 -
 85
85 -
 86
86 -
 87
87 -
 88
88 -
 89
89 -
 90
90 -
 91
91 -
 92
92 -
93
-
94
-
95
-
96
 |
 |

79
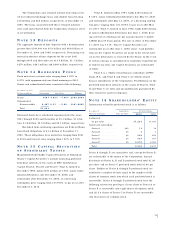
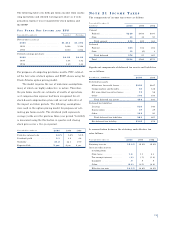
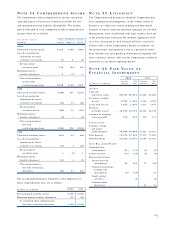
The following table sets forth pro forma income from contin-
uing operations and diluted earnings per share as if com-
pensation expense was recognized for stock options and
the ESPP.
PR O FO R M A NE T IN C O M E A N D E P S
Year ended December 31 Reported Pro forma
Net income (in millions)
2000 . . . . . . . . . . . . . . . . . . . . . . . $1,214 $1,196
1999 . . . . . . . . . . . . . . . . . . . . . . . . 1,202 1,194
1998 . . . . . . . . . . . . . . . . . . . . . . . . 1,080 1,064
Diluted earnings per share . . . . . . . . . .
2000 . . . . . . . . . . . . . . . . . . . . . . . $4.09 $4.02
1999 . . . . . . . . . . . . . . . . . . . . . . . . 3.94 3.92
1998 . . . . . . . . . . . . . . . . . . . . . . . . 3.49 3.43
For purposes of computing pro forma results, PNC estimat-
ed the fair value of stock options and ESPP shares using the
Black-Scholes option pricing model.
The model requires the use of numerous assumptions,
many of which are highly subjective in nature. Therefore,
the pro forma results are estimates of results of operations
as if compensation expense had been recognized for all
stock-based compensation plans and are not indicative of
the impact on future periods. The following assumptions
were used in the option pricing model for purposes of esti-
mating pro forma results. The dividend yield represents
average yields over the previous three-year period. Volatility
is measured using the fluctuation in quarter-end closing
stock prices over a five-year period.
Year ended December 31 2000 1999 1998
Risk-free interest rate . . . . . . . 6.6% 5.2% 5.5%
Dividend yield . . . . . . . . . . . . . 3.1 3.6 4.4
Volatility . . . . . . . . . . . . . . . . . 21.8 22.1 19.9
Expected life . . . . . . . . . . . . . . 5 yrs. 6 yrs. 6 yrs.
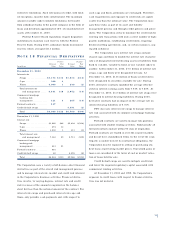
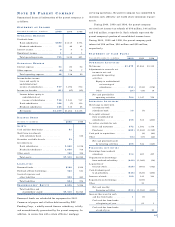
NO T E 2 1 IN C O M E TA X E S
The components of income taxes were as follows:
Year ended December 31
In millions 2 000 1999 1998
Current
Federal . . . . . . . . . . . . . . . . $226 $454 $307
State . . . . . . . . . . . . . . . . . . 32 35 57
Total current . . . . . . . . . . 258 489 364
Deferred
Federal . . . . . . . . . . . . . . . . 363 102 204
State . . . . . . . . . . . . . . . . . . 13 (5) 3
Total deferred . . . . . . . . . 376 97 207
Total . . . . . . . . . . . . . . . . . . $634 $586 $571
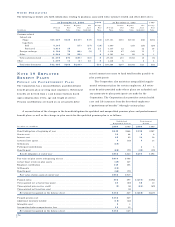
Significant components of deferred tax assets and liabilities
are as follows:
December 31 - in millions 2000 1999
Deferred tax assets
Allowance for credit losses . . . . . . . . $250 $247
Compensation and benefits . . . . . . . . 85 128
Net unrealized securities losses . . . . 19 58
Other . . . . . . . . . . . . . . . . . . . . . . . . 104 158
Total deferred tax assets . . . . . . . . 458 591
Deferred tax liabilities
Leasing . . . . . . . . . . . . . . . . . . . . . . 824 548
Depreciation . . . . . . . . . . . . . . . . . . 37 29
Other . . . . . . . . . . . . . . . . . . . . . . . . 102 90
Total deferred tax liabilities . . . . . 963 667
Net deferred tax liability . . . . . . . . . . $505 $76
A reconciliation between the statutory and effective tax
rates follows:
Year ended December 31 2000 1999 1998
Statutory tax rate . . . . . . . . . . . 35.0% 35.0% 35.0%
Increases (decreases)
resulting from
State taxes . . . . . . . . . . . . . . 1.6 1.1 2.3
Tax-exempt interest . . . . . . . (.6) (.7) (1.0)
Goodwill . . . . . . . . . . . . . . . .9 .9 .9
Other . . . . . . . . . . . . . . . . . (2.6) (3.5) (2.6)
Effective tax rate . . . . . . . . . 34.3% 32.8% 34.6%