PNC Bank 2000 Annual Report Download - page 85
Download and view the complete annual report
Please find page 85 of the 2000 PNC Bank annual report below. You can navigate through the pages in the report by either clicking on the pages listed below, or by using the keyword search tool below to find specific information within the annual report.-
 1
1 -
2
-
3
-
4
-
5
-
6
-
7
-
8
-
9
-
10
-
11
-
12
-
13
-
14
-
15
-
16
-
17
-
18
-
19
-
20
-
21
-
22
-
23
-
24
-
25
-
26
-
27
-
28
-
29
-
30
-
31
-
32
-
33
-
34
-
35
-
36
-
37
-
38
-
39
-
40
-
41
-
42
-
43
-
44
-
45
-
46
-
47
-
48
-
49
-
50
-
51
-
52
-
53
-
54
-
55
-
56
-
57
-
58
-
59
-
60
-
61
-
62
-
63
-
64
-
65
-
66
-
67
-
68
-
69
-
70
-
71
-
72
-
73
-
74
-
 75
75 -
 76
76 -
 77
77 -
 78
78 -
 79
79 -
 80
80 -
 81
81 -
 82
82 -
 83
83 -
 84
84 -
 85
85 -
 86
86 -
 87
87 -
 88
88 -
 89
89 -
 90
90 -
 91
91 -
 92
92 -
 93
93 -
 94
94 -
 95
95 -
96
 |
 |

82
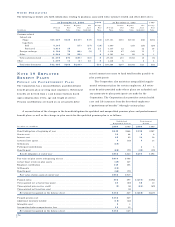
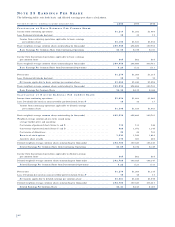
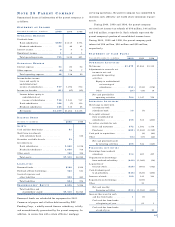
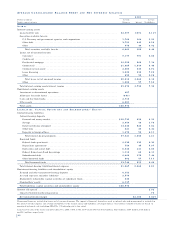
NO T E 2 3 EA R N I N G S PE R SH A R E
The following table sets forth basic and diluted earnings per share calculations.
Year ended December 31 - in millions, except share and per share data 2000 1999 1998
CA L C U L AT I O N O F BA S I C EA R N I N G S PE R CO M M O N SH A R E
Income from continuing operations . . . . . . . . . . . . . . . . . . . . . . . . . . . . . . . . . . . . . . . . . $1,214 $1,202 $1,080
Less: Preferred dividends declared . . . . . . . . . . . . . . . . . . . . . . . . . . . . . . . . . . . . . . . . . 19 19 19
Income from continuing operations applicable to basic earnings
per common share . . . . . . . . . . . . . . . . . . . . . . . . . . . . . . . . . . . . . . . . . . . . . . . . . $1,195 $1,183 $1,061
Basic weighted-average common shares outstanding (in thousands) . . . . . . . . . . . . . . . . . 289,958 296,886 300,761
Basic Earnings Per Common Share from Continuing Operations . . . . . . . . . . . . . . . . . $4.12 $3.98 $3.53
Income from discontinued operations applicable to basic earnings
per common share . . . . . . . . . . . . . . . . . . . . . . . . . . . . . . . . . . . . . . . . . . . . . . . . . . . $65 $62 $35
Basic weighted-average common shares outstanding (in thousands) . . . . . . . . . . . . . . . . . 289,958 296,886 300,761
Basic Earnings Per Common Share from Discontinued Operations . . . . . . . . . . . . . . . $.23 $.21 $.11
Net income . . . . . . . . . . . . . . . . . . . . . . . . . . . . . . . . . . . . . . . . . . . . . . . . . . . . . . . . . . $1,279 $1,264 $1,115
Less: Preferred dividends declared . . . . . . . . . . . . . . . . . . . . . . . . . . . . . . . . . . . . . . . . . 19 19 19
Net income applicable to basic earnings per common share . . . . . . . . . . . . . . . . . . . . . $1,260 $1,245 $1,096
Basic weighted-average common shares outstanding (in thousands) . . . . . . . . . . . . . . . . . 289,958 296,886 300,761
Basic Earnings Per Common Share . . . . . . . . . . . . . . . . . . . . . . . . . . . . . . . . . . . . . . . $4.35 $4.19 $3.64
CA L C U L AT I O N O F DI L U T E D EA R N I N G S PE R CO M M O N SH A R E
Income from continuing operations . . . . . . . . . . . . . . . . . . . . . . . . . . . . . . . . . . . . . . . . . $1,214 $1,202 $1,080
Less: Dividends declared on nonconvertible preferred stock Series F . . . . . . . . . . . . . . . 18 18 17
Income from continuing operations applicable to diluted earnings
per common share . . . . . . . . . . . . . . . . . . . . . . . . . . . . . . . . . . . . . . . . . . . . . . . . . $1,196 $1,184 $1,063
Basic weighted-average common shares outstanding (in thousands) . . . . . . . . . . . . . . . . . 289,958 296,886 300,761
Weighted-average common shares to be issued using
average market price and assuming:
Conversion of preferred stock Series A and B . . . . . . . . . . . . . . . . . . . . . . . . . . . . . . . 118 131 148
Conversion of preferred stock Series C and D . . . . . . . . . . . . . . . . . . . . . . . . . . . . . . . 986 1,072 1,145
Conversion of debentures . . . . . . . . . . . . . . . . . . . . . . . . . . . . . . . . . . . . . . . . . . . . . . 20 24 761
Exercise of stock options . . . . . . . . . . . . . . . . . . . . . . . . . . . . . . . . . . . . . . . . . . . . . . 1,531 1,529 1,846
Incentive share awards . . . . . . . . . . . . . . . . . . . . . . . . . . . . . . . . . . . . . . . . . . . . . . . . 173 383 486
Diluted weighted-average common shares outstanding (in thousands) . . . . . . . . . . . . . . . 292,786 300,025 305,147
Diluted Earnings Per Common Share from Continuing Operations . . . . . . . . . . . . . . . $4.09 $3.94 $3.49
Income from discontinued operations applicable to diluted earnings
per common share . . . . . . . . . . . . . . . . . . . . . . . . . . . . . . . . . . . . . . . . . . . . . . . . . . . $65 $62 $35
Diluted weighted-average common shares outstanding (in thousands) . . . . . . . . . . . . . . . 292,786 300,025 305,147
Diluted Earnings Per Common Share from Discontinued Operations . . . . . . . . . . . . . . $.22 $.21 $.11
Net income . . . . . . . . . . . . . . . . . . . . . . . . . . . . . . . . . . . . . . . . . . . . . . . . . . . . . . . . . . $1,279 $1,264 $1,115
Less: Dividends declared on nonconvertible preferred stock Series F . . . . . . . . . . . . . . . 18 18 17
Net income applicable to diluted earnings per common share . . . . . . . . . . . . . . . . . . . $1,261 $1,246 $1,098
Diluted weighted-average common shares outstanding (in thousands) . . . . . . . . . . . . . . . 292,786 300,025 305,147
Diluted Earnings Per Common Share . . . . . . . . . . . . . . . . . . . . . . . . . . . . . . . . . . . . . $4.31 $4.15 $3.60