Capital One 2003 Annual Report Download - page 97
Download and view the complete annual report
Please find page 97 of the 2003 Capital One annual report below. You can navigate through the pages in the report by either clicking on the pages listed below, or by using the keyword search tool below to find specific information within the annual report.-
 1
1 -
2
-
3
-
4
-
5
-
6
-
7
-
8
-
9
-
10
-
11
-
12
-
13
-
14
-
15
-
16
-
17
-
18
-
19
-
20
-
21
-
22
-
23
-
24
-
25
-
26
-
27
-
28
-
29
-
30
-
31
-
32
-
33
-
34
-
35
-
36
-
37
-
38
-
39
-
40
-
41
-
42
-
43
-
44
-
45
-
46
-
47
-
48
-
49
-
50
-
51
-
52
-
53
-
54
-
55
-
56
-
57
-
58
-
59
-
60
-
61
-
62
-
63
-
64
-
65
-
66
-
67
-
68
-
69
-
70
-
71
-
72
-
73
-
74
-
75
-
76
-
77
-
78
-
79
-
80
-
81
-
82
-
83
-
84
-
85
-
86
-
 87
87 -
 88
88 -
 89
89 -
 90
90 -
 91
91 -
 92
92 -
 93
93 -
 94
94 -
 95
95 -
 96
96 -
 97
97 -
 98
98 -
 99
99 -
 100
100 -
 101
101 -
 102
102 -
 103
103 -
 104
104 -
 105
105 -
 106
106 -
 107
107 -
108
-
109
-
110
-
111
-
112
-
113
-
114
-
115
-
116
-
117
-
118
-
119
-
120
-
121
-
122
-
123
-
124
-
125
-
126
-
127
-
128
-
129
-
130
-
131
-
132
-
133
-
134
-
135
-
136
 |
 |

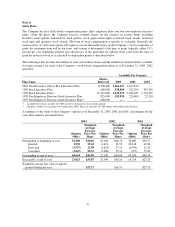
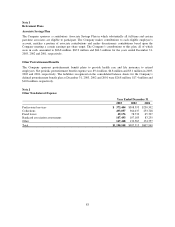
Note G
Stock Plans
The Company has five stock-based compensation plans: three employee plans and two non-employee directors
plans. Under the plans, the Company reserves common shares for the issuance in various forms including
incentive stock options, nonstatutory stock options, stock appreciation rights, restricted stock awards, restricted
stock units and incentive stock awards. The form of stock compensation is specific to each plan. Generally the
exercise price of each stock option will equal or exceed the market price of the Company’s stock on the date of
grant, the maximum term will be ten years, and vesting is determined at the time of grant, typically either 33
1
⁄
3
percent per year beginning with the first anniversary of the grant date for options, three years from the time of
grant for restricted stock or accelerated vesting option grants as described below.
The following table provides the number of reserved common shares and the number of common shares available
for future issuance for each of the Company’s stock-based compensation plans as of December 31, 2003, 2002
and 2001:
Available For Issuance
Plan Name
Shares
Reserved 2003 2002 2001
2002 Non-Executive Officer Stock Incentive Plan 8,500,000 1,464,227 2,167,450 —
1999 Stock Incentive Plan 600,000 338,800 322,300 305,350
1994 Stock Incentive Plan(1) 67,112,640 1,423,352 2,186,615 2,770,459
1999 Non-Employee Directors Stock Incentive Plan 825,000 195,920 220,000 22,510
1995 Non-Employee Directors Stock Incentive Plan(2) 600,000 ———
(1) Available for issuance includes the CEO incentive stock grant at its maximum amount.
(2) The plan’s ability to issue grants was terminated in 1999. There are currently 457,500 options outstanding under the plan.
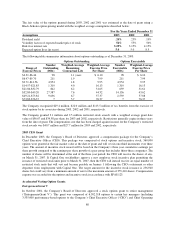
A summary of the status of the Company’s options as of December 31, 2003, 2002 and 2001, and changes for the
years then ended is presented below:
2003 2002 2001
Options
(000s)
Weighted-
Average
Exercise
Price Per
Share
Options
(000s)
Weighted-
Average
Exercise
Price Per
Share
Options
(000s)
Weighted-
Average
Exercise
Price Per
Share
Outstanding at beginning of year 52,108 $40.06 49,180 $40.74 36,689 $30.57
Granted 1,930 55.42 6,631 36.52 20,148 49.84
Exercised (5,737) 23.99 (1,623) 27.19 (6,950) 12.29
Cancelled (3,647) 50.76 (2,080) 53.31 (707) 55.89
Outstanding at end of year 44,654 $42.00 52,108 $40.06 49,180 $40.74
Exercisable at end of year 23,923 $35.87 23,340 $30.20 18,714 $23.25
Weighted-average fair value of options
granted during the year $27.27 $16.53 $29.73
79