Capital One 2003 Annual Report Download - page 59
Download and view the complete annual report
Please find page 59 of the 2003 Capital One annual report below. You can navigate through the pages in the report by either clicking on the pages listed below, or by using the keyword search tool below to find specific information within the annual report.-
 1
1 -
2
-
3
-
4
-
5
-
6
-
7
-
8
-
9
-
10
-
11
-
12
-
13
-
14
-
15
-
16
-
17
-
18
-
19
-
20
-
21
-
22
-
23
-
24
-
25
-
26
-
27
-
28
-
29
-
30
-
31
-
32
-
33
-
34
-
35
-
36
-
37
-
38
-
39
-
40
-
41
-
42
-
43
-
44
-
45
-
46
-
47
-
48
-
 49
49 -
 50
50 -
 51
51 -
 52
52 -
 53
53 -
 54
54 -
 55
55 -
 56
56 -
 57
57 -
 58
58 -
 59
59 -
 60
60 -
 61
61 -
 62
62 -
 63
63 -
 64
64 -
 65
65 -
 66
66 -
 67
67 -
 68
68 -
 69
69 -
70
-
71
-
72
-
73
-
74
-
75
-
76
-
77
-
78
-
79
-
80
-
81
-
82
-
83
-
84
-
85
-
86
-
87
-
88
-
89
-
90
-
91
-
92
-
93
-
94
-
95
-
96
-
97
-
98
-
99
-
100
-
101
-
102
-
103
-
104
-
105
-
106
-
107
-
108
-
109
-
110
-
111
-
112
-
113
-
114
-
115
-
116
-
117
-
118
-
119
-
120
-
121
-
122
-
123
-
124
-
125
-
126
-
127
-
128
-
129
-
130
-
131
-
132
-
133
-
134
-
135
-
136
 |
 |

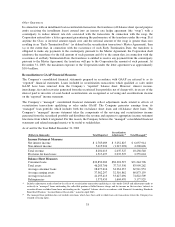
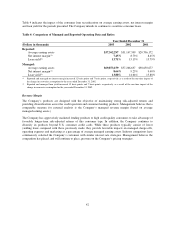
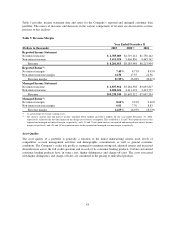
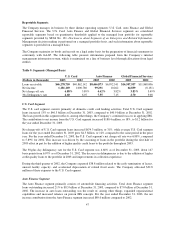
Managed Consumer Loan Portfolio
The Company’s managed consumer loan portfolio is comprised of on-balance sheet and off-balance sheet loans.
The Company analyzes its financial performance on a managed consumer loan portfolio basis. The managed
consumer loan portfolio includes securitized loans for which the Company has retained significant risks and
potential returns. Table 3 summarizes the Company’s managed consumer loan portfolio.
Table 3: Managed Consumer Loan Portfolio
Year Ended December 31
(Dollars in thousands) 2003 2002 2001 2000 1999
Year-End Balances:
Reported consumer loans:
Domestic $29,848,366 $24,581,555 $18,546,426 $12,591,561 $ 7,783,535
International 3,001,903 2,762,375 2,374,588 2,521,151 2,130,014
Total 32,850,269 27,343,930 20,921,014 15,112,712 9,913,549
Securitization Adjustments:
Domestic 33,749,566 29,834,441 22,747,293 13,961,714 10,013,424
International 4,644,961 2,568,166 1,595,656 449,600 309,615
Total 38,394,527 32,402,607 24,342,949 14,411,314 10,323,039
Managed consumer loan portfolio:
Domestic 63,597,932 54,415,996 41,293,719 26,553,275 17,796,959
International 7,646,864 5,330,541 3,970,244 2,970,751 2,439,629
Total $71,244,796 $59,746,537 $45,263,963 $29,524,026 $20,236,588
Average Balances:
Reported consumer loans:
Domestic $25,923,208 $22,248,006 $14,648,298 $ 9,320,165 $ 5,784,662
International 2,754,408 2,788,013 2,636,008 2,167,611 1,882,693
Total 28,677,616 25,036,019 17,284,306 11,487,776 7,667,355
Securitization Adjustments:
Domestic 30,980,006 25,812,000 17,718,683 10,804,845 10,062,771
International 3,254,331 1,951,547 609,328 342,241 316,787
Total 34,234,337 27,763,547 18,328,011 11,147,086 10,379,558
Managed consumer loan portfolio:
Domestic 56,903,214 48,060,006 32,366,981 20,125,010 15,847,433
International 6,008,739 4,739,560 3,245,336 2,509,852 2,199,480
Total $62,911,953 $52,799,566 $35,612,317 $22,634,862 $18,046,913
41