Capital One 2003 Annual Report Download - page 121
Download and view the complete annual report
Please find page 121 of the 2003 Capital One annual report below. You can navigate through the pages in the report by either clicking on the pages listed below, or by using the keyword search tool below to find specific information within the annual report.-
 1
1 -
2
-
3
-
4
-
5
-
6
-
7
-
8
-
9
-
10
-
11
-
12
-
13
-
14
-
15
-
16
-
17
-
18
-
19
-
20
-
21
-
22
-
23
-
24
-
25
-
26
-
27
-
28
-
29
-
30
-
31
-
32
-
33
-
34
-
35
-
36
-
37
-
38
-
39
-
40
-
41
-
42
-
43
-
44
-
45
-
46
-
47
-
48
-
49
-
50
-
51
-
52
-
53
-
54
-
55
-
56
-
57
-
58
-
59
-
60
-
61
-
62
-
63
-
64
-
65
-
66
-
67
-
68
-
69
-
70
-
71
-
72
-
73
-
74
-
75
-
76
-
77
-
78
-
79
-
80
-
81
-
82
-
83
-
84
-
85
-
86
-
87
-
88
-
89
-
90
-
91
-
92
-
93
-
94
-
95
-
96
-
97
-
98
-
99
-
100
-
101
-
102
-
103
-
104
-
105
-
106
-
107
-
108
-
109
-
110
-
 111
111 -
 112
112 -
 113
113 -
 114
114 -
 115
115 -
 116
116 -
 117
117 -
 118
118 -
 119
119 -
 120
120 -
 121
121 -
 122
122 -
 123
123 -
 124
124 -
 125
125 -
 126
126 -
 127
127 -
 128
128 -
 129
129 -
 130
130 -
 131
131 -
132
-
133
-
134
-
135
-
136
 |
 |

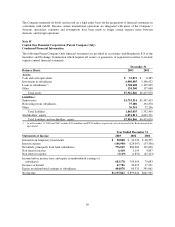
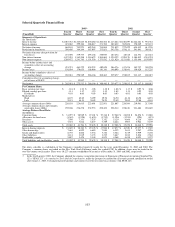
Selected Quarterly Financial Data
2003(1) 2002
(Unaudited)
Fourth
Quarter
Third
Quarter
Second
Quarter
First
Quarter
Fourth
Quarter
Third
Quarter
Second
Quarter
First
Quarter
Summary of Operations:
(In Thousands)
Interest income $1,087,783 $1,103,025 $1,070,280 $1,106,566 $1,113,664 $1,108,079 $1,024,661 $ 934,361
Interest expense 423,682 399,104 388,017 371,762 382,632 385,650 370,249 323,123
Net interest income 664,101 703,921 682,263 734,804 731,032 722,429 654,412 611,238
Provision for loan losses 390,405 364,144 387,097 375,851 543,758 674,111 541,841 389,617
Net interest income after provision for
loan losses 273,696 339,777 295,166 358,953 187,274 48,318 112,571 221,621
Non-interest income 1,437,491 1,363,208 1,310,622 1,304,603 1,320,322 1,520,178 1,384,812 1,241,524
Non-interest expense 1,289,472 1,241,763 1,151,556 1,173,932 1,121,020 1,151,020 1,153,646 1,159,895
Income before income taxes and
cumulative effect of accounting
change 421,715 461,222 454,232 489,624 386,576 417,476 343,737 303,250
Income taxes 156,034 170,653 168,066 181,161 146,899 158,641 130,620 115,235
Income before cumulative effect of
accounting change 265,681 290,569 286,166 308,463 239,677 258,835 213,117 188,015
Cumulative effect of accounting change,
netoftaxesof$8,832 —15,037——————
Net income $ 265,681 $ 275,532 $ 286,166 $ 308,463 $ 239,677 $ 258,835 $ 213,117 $ 188,015
Per Common Share:
Basic earnings per share $ 1.16 $ 1.23 $ 1.28 1.38 $ 1.08 $ 1.17 $ 0.97 $ 0.86
Diluted earnings per share 1.11 1.17 1.23 1.35 1.05 1.13 0.92 0.83
Dividends 0.03 0.03 0.03 0.03 0.03 0.03 0.03 0.03
Market prices
High 64.25 62.02 54.99 39.70 36.50 61.10 66.50 64.91
Low 55.15 44.51 30.05 24.91 25.49 24.05 52.00 43.01
Average common shares (000s) 228,110 224,615 223,691 222,951 221,807 220,564 219,961 217,548
Average common shares and common
equivalent shares (000s) 239,206 236,270 232,553 228,422 228,214 228,418 231,684 226,605
Average Balance Sheet Data:
(In Millions)
Consumer loans $ 31,297 $ 28,949 $ 27,101 $ 27,316 $ 27,260 $ 26,058 $ 24,876 $ 21,880
Allowance for loan losses (1,567) (1,590) (1,635) (1,719) (1,596) (1,241) (994) (873)
Securities 7,598 7,331 7,535 5,352 5,120 4,666 4,216 3,850
Other assets 7,674 7,014 6,677 7,369 6,424 5,987 5,942 5,139
Total assets $ 45,002 $ 41,704 $ 39,678 $ 38,318 $ 37,208 $ 35,470 $ 34,040 $ 29,996
Interest-bearing deposits $ 21,605 $ 20,303 $ 19,178 $ 17,940 $ 17,077 $ 16,520 $ 15,277 $ 13,505
Other borrowings 7,661 6,892 6,683 7,010 6,332 5,631 5,947 4,926
Senior and deposit notes 6,735 6,066 5,534 5,310 5,564 5,719 5,959 5,430
Other liabilities 3,114 3,019 3,135 3,235 3,667 3,182 2,836 2,563
Stockholder’s equity 5,887 5,424 5,148 4,823 4,568 4,418 4,021 3,572
Total liabilities and stockholders’ equity $ 45,002 $ 41,704 $ 39,678 $ 38,318 $ 37,208 $ 35,470 $ 34,040 $ 29,996
The above schedule is a tabulation of the Company’s unaudited quarterly results for the years ended December 31, 2003 and 2002. The
Company’s common shares are traded on the New York Stock Exchange under the symbol COF. In addition, shares may be traded in the
over-the-counter stock market. There were 10,227 common stockholders of record as of December 31, 2003 and 2002, respectively.
(1) In the fourth quarter 2003, the Company adopted the expense recognition provisions of Statement of Financial Accounting Standard No.
123, (“SFAS 123”) Accounting for Stock Based Compensation, under the prospective method for all awards granted, modified or settled
after January 1, 2003. Certain prior period amounts and statistics have been restated in accordance with SFAS 123.
103