Capital One 2003 Annual Report Download - page 60
Download and view the complete annual report
Please find page 60 of the 2003 Capital One annual report below. You can navigate through the pages in the report by either clicking on the pages listed below, or by using the keyword search tool below to find specific information within the annual report.-
 1
1 -
2
-
3
-
4
-
5
-
6
-
7
-
8
-
9
-
10
-
11
-
12
-
13
-
14
-
15
-
16
-
17
-
18
-
19
-
20
-
21
-
22
-
23
-
24
-
25
-
26
-
27
-
28
-
29
-
30
-
31
-
32
-
33
-
34
-
35
-
36
-
37
-
38
-
39
-
40
-
41
-
42
-
43
-
44
-
45
-
46
-
47
-
48
-
49
-
 50
50 -
 51
51 -
 52
52 -
 53
53 -
 54
54 -
 55
55 -
 56
56 -
 57
57 -
 58
58 -
 59
59 -
 60
60 -
 61
61 -
 62
62 -
 63
63 -
 64
64 -
 65
65 -
 66
66 -
 67
67 -
 68
68 -
 69
69 -
 70
70 -
71
-
72
-
73
-
74
-
75
-
76
-
77
-
78
-
79
-
80
-
81
-
82
-
83
-
84
-
85
-
86
-
87
-
88
-
89
-
90
-
91
-
92
-
93
-
94
-
95
-
96
-
97
-
98
-
99
-
100
-
101
-
102
-
103
-
104
-
105
-
106
-
107
-
108
-
109
-
110
-
111
-
112
-
113
-
114
-
115
-
116
-
117
-
118
-
119
-
120
-
121
-
122
-
123
-
124
-
125
-
126
-
127
-
128
-
129
-
130
-
131
-
132
-
133
-
134
-
135
-
136
 |
 |

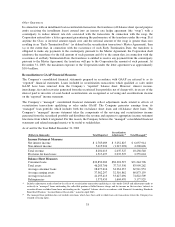
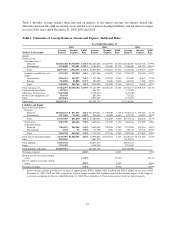
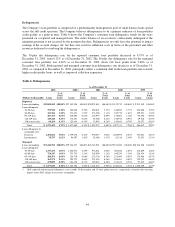
Table 4 indicates the impact of the consumer loan securitizations on average earning assets, net interest margin
and loan yield for the periods presented. The Company intends to continue to securitize consumer loans.
Table 4: Comparison of Managed and Reported Operating Data and Ratios
Year Ended December 31
(Dollars in thousands) 2003 2002 2001
Reported:
Average earning assets $37,362,297 $31,147,599 $20,706,172
Net interest margin(1) 7.45% 8.73% 8.45%
Loan yield(2) 13.71% 15.15% 15.79%
Managed:
Average earning assets $69,873,159 $57,266,637 $38,650,677
Net interest margin(1) 8.64% 9.23% 9.40%
Loan yield(2) 13.88% 14.64% 15.88%
(1) Reported and managed net interest margin increased 12 basis points and 7 basis points, respectively, as a result of the one-time impact of
the change in recoveries assumption for the year ended December 31, 2002.
(2) Reported and managed loan yield increased 15 basis points and 7 basis points, respectively, as a result of the one-time impact of the
change in recoveries assumption for the year ended December 31, 2002.
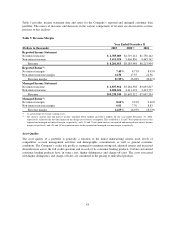
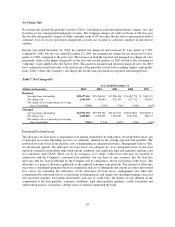
Revenue Margin
The Company’s products are designed with the objective of maintaining strong risk-adjusted returns and
providing diversification across the credit spectrum and consumer lending products. Management believes that a
comparable measure for external analysis is the Company’s managed revenue margin (based on average
managed earning assets.)
The Company has aggressively marketed lending products to high credit quality consumers to take advantage of
favorable longer-term risk-adjusted returns of this consumer type. In addition, the Company continues to
diversify its products beyond U.S. consumer credit cards. While these products typically consist of lower
yielding loans compared with those previously made, they provide favorable impacts on managed charge-offs,
operating expenses and marketing as a percentage of average managed earning assets. Industry competitors have
continuously solicited the Company’s customers with similar interest rate strategies. Management believes the
competition has placed, and will continue to place, pressure on the Company’s pricing strategies.
42