Capital One 2003 Annual Report Download - page 104
Download and view the complete annual report
Please find page 104 of the 2003 Capital One annual report below. You can navigate through the pages in the report by either clicking on the pages listed below, or by using the keyword search tool below to find specific information within the annual report.-
 1
1 -
2
-
3
-
4
-
5
-
6
-
7
-
8
-
9
-
10
-
11
-
12
-
13
-
14
-
15
-
16
-
17
-
18
-
19
-
20
-
21
-
22
-
23
-
24
-
25
-
26
-
27
-
28
-
29
-
30
-
31
-
32
-
33
-
34
-
35
-
36
-
37
-
38
-
39
-
40
-
41
-
42
-
43
-
44
-
45
-
46
-
47
-
48
-
49
-
50
-
51
-
52
-
53
-
54
-
55
-
56
-
57
-
58
-
59
-
60
-
61
-
62
-
63
-
64
-
65
-
66
-
67
-
68
-
69
-
70
-
71
-
72
-
73
-
74
-
75
-
76
-
77
-
78
-
79
-
80
-
81
-
82
-
83
-
84
-
85
-
86
-
87
-
88
-
89
-
90
-
91
-
92
-
93
-
 94
94 -
 95
95 -
 96
96 -
 97
97 -
 98
98 -
 99
99 -
 100
100 -
 101
101 -
 102
102 -
 103
103 -
 104
104 -
 105
105 -
 106
106 -
 107
107 -
 108
108 -
 109
109 -
 110
110 -
 111
111 -
 112
112 -
 113
113 -
 114
114 -
115
-
116
-
117
-
118
-
119
-
120
-
121
-
122
-
123
-
124
-
125
-
126
-
127
-
128
-
129
-
130
-
131
-
132
-
133
-
134
-
135
-
136
 |
 |

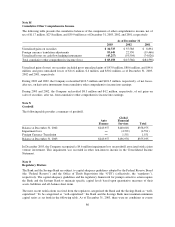
Note M
Cumulative Other Comprehensive Income
The following table presents the cumulative balances of the components of other comprehensive income, net of
tax of $11.7 million, $27.8 million, and $39.9 million as of December 31, 2003, 2002, and 2001, respectively:
As of December 31
2003 2002 2001
Unrealized gains on securities $ 34,735 $ 55,588 $ 8,894
Foreign currency translation adjustments 93,640 22,350 (19,466)
Unrealized losses on cash flow hedging instruments (45,217) (93,504) (74,026)
Total cumulative other comprehensive income (loss) $ 83,158 $(15,566) $(84,598)
Unrealized gains (losses) on securities included gross unrealized gains of $43.0 million, $80.6 million, and $44.6
million, and gross unrealized losses of $11.6 million, $.4 million, and $30.2 million, as of December 31, 2003,
2002 and 2001, respectively.
During 2003 and 2002, the Company reclassified $110.5 million and $101.5 million, respectively, of net losses,
after tax, on derivative instruments from cumulative other comprehensive income into earnings.
During 2003 and 2002, the Company reclassified $8.3 million and $4.2 million, respectively, of net gains on
sales of securities, after tax, from cumulative other comprehensive income into earnings.
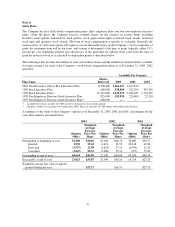
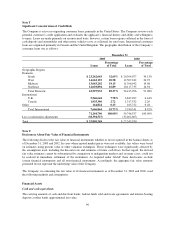
Note N
Goodwill
The following table provides a summary of goodwill.
Auto
Finance
Global
Financial
Services Total
Balance at December 31, 2002 $218,957 $140,018 $358,975
Impairment Loss —(4,591) (4,591)
Foreign Currency Translation —1,551 1,551
Balance at December 31, 2003 $218,957 $136,978 $355,935
In December 2003, the Company recognized a $4.6 million impairment loss on goodwill associated with a joint
venture investment. This impairment was recorded in other non-interest income in the Consolidated Income
Statement.
Note O
Regulatory Matters
The Bank and the Savings Bank are subject to capital adequacy guidelines adopted by the Federal Reserve Board
(the “Federal Reserve”) and the Office of Thrift Supervision (the “OTS”) (collectively, the “regulators”),
respectively. The capital adequacy guidelines and the regulatory framework for prompt corrective action require
the Bank and the Savings Bank to maintain specific capital levels based upon quantitative measures of their
assets, liabilities and off-balance sheet items.
The most recent notifications received from the regulators categorized the Bank and the Savings Bank as “well-
capitalized.” To be categorized as “well-capitalized,” the Bank and the Savings Bank must maintain minimum
capital ratios as set forth in the following table. As of December 31, 2003, there were no conditions or events
86