Capital One 2003 Annual Report Download - page 93
Download and view the complete annual report
Please find page 93 of the 2003 Capital One annual report below. You can navigate through the pages in the report by either clicking on the pages listed below, or by using the keyword search tool below to find specific information within the annual report.-
 1
1 -
2
-
3
-
4
-
5
-
6
-
7
-
8
-
9
-
10
-
11
-
12
-
13
-
14
-
15
-
16
-
17
-
18
-
19
-
20
-
21
-
22
-
23
-
24
-
25
-
26
-
27
-
28
-
29
-
30
-
31
-
32
-
33
-
34
-
35
-
36
-
37
-
38
-
39
-
40
-
41
-
42
-
43
-
44
-
45
-
46
-
47
-
48
-
49
-
50
-
51
-
52
-
53
-
54
-
55
-
56
-
57
-
58
-
59
-
60
-
61
-
62
-
63
-
64
-
65
-
66
-
67
-
68
-
69
-
70
-
71
-
72
-
73
-
74
-
75
-
76
-
77
-
78
-
79
-
80
-
81
-
82
-
 83
83 -
 84
84 -
 85
85 -
 86
86 -
 87
87 -
 88
88 -
 89
89 -
 90
90 -
 91
91 -
 92
92 -
 93
93 -
 94
94 -
 95
95 -
 96
96 -
 97
97 -
 98
98 -
 99
99 -
 100
100 -
 101
101 -
 102
102 -
 103
103 -
104
-
105
-
106
-
107
-
108
-
109
-
110
-
111
-
112
-
113
-
114
-
115
-
116
-
117
-
118
-
119
-
120
-
121
-
122
-
123
-
124
-
125
-
126
-
127
-
128
-
129
-
130
-
131
-
132
-
133
-
134
-
135
-
136
 |
 |

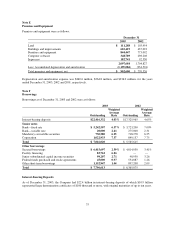
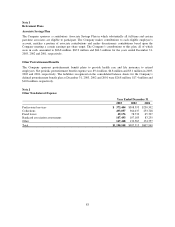
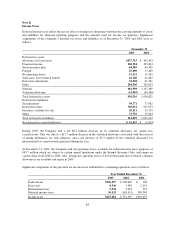
Note E
Premises and Equipment
Premises and equipment were as follows:
December 31
2003 2002
Land $ 111,288 $ 103,954
Buildings and improvements 610,419 437,023
Furniture and equipment 844,447 773,092
Computer software 348,789 298,208
In process 182,741 92,550
2,097,684 1,704,827
Less: Accumulated depreciation and amortization (1,195,084) (934,501)
Total premises and equipment, net $ 902,600 $ 770,326
Depreciation and amortization expense was $260.6 million, $264.8 million, and $236.0 million, for the years
ended December 31, 2003, 2002 and 2001, respectively.
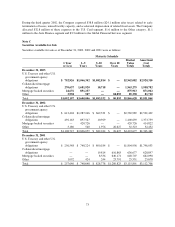
Note F
Borrowings
Borrowings as of December 31, 2003 and 2002 were as follows:
2003 2002
Outstanding
Weighted
Average
Rate Outstanding
Weighted
Average
Rate
Interest-bearing deposits $22,416,332 4.03% $17,325,965 4.65%
Senior notes
Bank—fixed rate $ 5,242,507 6.37% $ 3,723,200 7.00%
Bank—variable rate 20,000 2.41 275,000 2.31
Mandatory convertible securities 730,580 6.25 718,278 6.25
Corporation 1,022,933 7.37 849,137 7.75
Total $ 7,016,020 $ 5,565,615
Other borrowings
Secured borrowings $ 6,415,697 2.59% $ 4,814,030 3.41%
Facility financing 83,762 6.86 ——
Junior subordinated capital income securities 99,207 2.71 98,950 3.26
Federal funds purchased and resale agreements 45,000 0.97 554,887 1.26
Other short-term borrowings 1,152,947 1.44 897,208 2.09
Total $ 7,796,613 $ 6,365,075
Interest-Bearing Deposits
As of December 31, 2003, the Company had $22.4 billion in interest-bearing deposits of which $10.9 billion
represented large denomination certificates of $100 thousand or more, with original maturities of up to ten years.
75