Capital One 2003 Annual Report Download - page 57
Download and view the complete annual report
Please find page 57 of the 2003 Capital One annual report below. You can navigate through the pages in the report by either clicking on the pages listed below, or by using the keyword search tool below to find specific information within the annual report.-
 1
1 -
2
-
3
-
4
-
5
-
6
-
7
-
8
-
9
-
10
-
11
-
12
-
13
-
14
-
15
-
16
-
17
-
18
-
19
-
20
-
21
-
22
-
23
-
24
-
25
-
26
-
27
-
28
-
29
-
30
-
31
-
32
-
33
-
34
-
35
-
36
-
37
-
38
-
39
-
40
-
41
-
42
-
43
-
44
-
45
-
46
-
 47
47 -
 48
48 -
 49
49 -
 50
50 -
 51
51 -
 52
52 -
 53
53 -
 54
54 -
 55
55 -
 56
56 -
 57
57 -
 58
58 -
 59
59 -
 60
60 -
 61
61 -
 62
62 -
 63
63 -
 64
64 -
 65
65 -
 66
66 -
 67
67 -
68
-
69
-
70
-
71
-
72
-
73
-
74
-
75
-
76
-
77
-
78
-
79
-
80
-
81
-
82
-
83
-
84
-
85
-
86
-
87
-
88
-
89
-
90
-
91
-
92
-
93
-
94
-
95
-
96
-
97
-
98
-
99
-
100
-
101
-
102
-
103
-
104
-
105
-
106
-
107
-
108
-
109
-
110
-
111
-
112
-
113
-
114
-
115
-
116
-
117
-
118
-
119
-
120
-
121
-
122
-
123
-
124
-
125
-
126
-
127
-
128
-
129
-
130
-
131
-
132
-
133
-
134
-
135
-
136
 |
 |
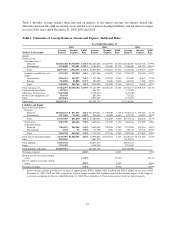
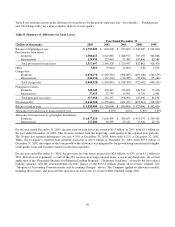
income increased $406.2 million, or 14%, to $3.2 billion for the year ended December 31, 2003, from $2.8
billion for the year ended December 31, 2002. This increase was primarily the result of a 24% increase in the
average off-balance sheet loan portfolio for the year ended December 31, 2003, compared to the same period in
the prior year, offset in part by a reduction in the excess spread generated by the off-balance sheet loan portfolio
due to decreased interest and fees and an increase in charge-offs.
Servicing and securitizations income increased $364.4 million, or 15%, to $2.8 billion for the year ended
December 31, 2002, from $2.4 billion in 2001. This increase was primarily due to a 49% increase in the average
off-balance sheet loan portfolio, offset in part by a reduction in the excess spread generated by the off-balance
sheet loan portfolio and a $33.1 million decrease in the fair value of interest-only strips.
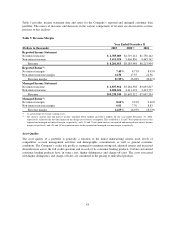
Service Charges and Other Customer-Related Fees
Service charges and other customer-related fees decreased by $307.6 million, or 16%, to $1.6 billion for the year
ended December 31, 2003 compared to $1.9 billion for the year ended December 31, 2002. $44.4 million of the
decrease relates to the one-time impact of the change in the recoveries estimate recognized in 2002. The
remaining decrease primarily reflects a shift in the mix of the reported loan portfolio towards higher credit
quality, lower fee-generating loans and a decrease in the number of accounts compared to the prior year.
Service charges and other customer-related fees increased by $401.4 million, or 26%, to $1.9 billion for the year
ended December 31, 2002. The increase primarily reflects an increase in the reported loan portfolio of
$6.4 billion or 31% over 2001 and a $44.4 million increase related to the one-time impact of the 2002 change in
the recoveries estimate (see “Adoption of Accouning Pronouncements and Accounting Changes” above) offset
by a shift in the mix of the reported loan portfolio toward a greater composition of lower fee-generating loans.
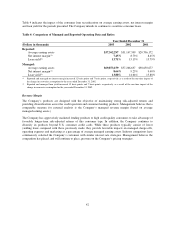
Interchange Income
Interchange income decreased $71.0 million, or 16%, to $376.8 million for the year ended December 31, 2003,
from $447.8 million for the year ended December 31, 2002. This decrease is primarily attributable to the
securitization of higher interchange yielding loans moving them off-balance sheet. Total interchange income is
net of $115.4 million of costs related to the Company’s rewards programs for the year ended December 31, 2003,
compared to $104.9 million for the year ended December 31, 2002.
Interchange income increased $68.0 million, or 18%, to $447.8 million for the year ended December 31, 2002,
from $379.8 million in 2001. This increase is primarily attributable to an increase in annual purchase volume.
Total interchange income is net of $104.9 million of costs related to the Company’s rewards programs for the
year ended December 31, 2002, compared to $110.9 million for the year ended December 31, 2001.
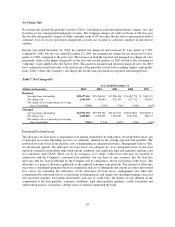
Other Non-Interest Income
Other non-interest income includes, among other items, gains and losses on sales of securities, gains and losses
associated with hedging transactions, service provider revenue generated by the Company’s patient finance
business, gains on the sale of auto loans and income earned related to the purchased charged-off loan portfolios.
Other non-interest income decreased $78.6 million, or 28%, to $197.3 million for the year ended
December 31, 2003 compared to $275.9 million for the same period in the prior year. The decrease in other
non-interest income was primarily due to $9.4 million of losses recognized on sales of securities for the year
ended December 31, 2003, compared to $77.5 million of gains recognized on sales of securities for the year
ended December 31, 2002. In addition, there were no gains recognized for senior note repurchases in 2003,
compared to $27.0 million recognized in 2002. There was a $23.6 million decrease in the fair value of free-
standing derivatives for the year ended December 31, 2003. These decreases were offset in part by a $38.2
39