Capital One 2003 Annual Report Download - page 58
Download and view the complete annual report
Please find page 58 of the 2003 Capital One annual report below. You can navigate through the pages in the report by either clicking on the pages listed below, or by using the keyword search tool below to find specific information within the annual report.-
 1
1 -
2
-
3
-
4
-
5
-
6
-
7
-
8
-
9
-
10
-
11
-
12
-
13
-
14
-
15
-
16
-
17
-
18
-
19
-
20
-
21
-
22
-
23
-
24
-
25
-
26
-
27
-
28
-
29
-
30
-
31
-
32
-
33
-
34
-
35
-
36
-
37
-
38
-
39
-
40
-
41
-
42
-
43
-
44
-
45
-
46
-
47
-
 48
48 -
 49
49 -
 50
50 -
 51
51 -
 52
52 -
 53
53 -
 54
54 -
 55
55 -
 56
56 -
 57
57 -
 58
58 -
 59
59 -
 60
60 -
 61
61 -
 62
62 -
 63
63 -
 64
64 -
 65
65 -
 66
66 -
 67
67 -
 68
68 -
69
-
70
-
71
-
72
-
73
-
74
-
75
-
76
-
77
-
78
-
79
-
80
-
81
-
82
-
83
-
84
-
85
-
86
-
87
-
88
-
89
-
90
-
91
-
92
-
93
-
94
-
95
-
96
-
97
-
98
-
99
-
100
-
101
-
102
-
103
-
104
-
105
-
106
-
107
-
108
-
109
-
110
-
111
-
112
-
113
-
114
-
115
-
116
-
117
-
118
-
119
-
120
-
121
-
122
-
123
-
124
-
125
-
126
-
127
-
128
-
129
-
130
-
131
-
132
-
133
-
134
-
135
-
136
 |
 |
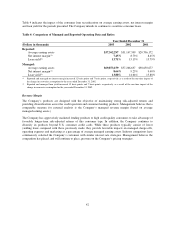
million increase in gains on sales of auto loans for the year ended December 31, 2003 and an increase in income
earned from purchased charged-off loan portfolios of $34.5 million for the year ended December 31, 2003,
compared to 2002.
Other non-interest income increased $169.4 million, or 159%, to $275.9 million for 2002 compared to $106.5
million for 2001. The increase in other non-interest income was primarily due to $77.5 million of gains on sales
of securities realized in 2002 in connection with the Company’s rebalancing of its liquidity portfolio compared to
$13.5 million realized in 2001. Other factors in the increase included gains related to senior note repurchases of
$27.0 million realized during 2002, an increase in service provider revenue of $9.4 million and an increase in
income earned from reaffirmed purchased charged-off loans of $24.1 million during the year ended December
31, 2002.
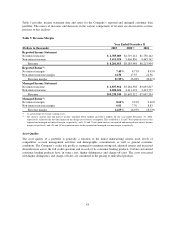
Non-Interest Expense
Non-interest expense, which consists of marketing and operating expenses, increased $271.1 million, or 6%, to
$4.9 billion for the year ended December 31, 2003 compared to $4.6 billion for the year ended
December 31, 2002. Marketing expense increased $47.8 million, or 4%, for the year ended December 31, 2003,
compared to the same period in the prior year. The increase is the result of the Company investing in new and
existing product opportunities. Operating expenses were $3.7 billion for the year ended December 31, 2003,
compared to $3.5 billion for December 31, 2002. The increase in operating expense of $223.3 was primarily due
to increased credit and recovery efforts of $137.1 million, investment in IT infrastructure to support future
growth of $30.0 million and costs associated with the expansion of the Company’s enterprise risk management
programs and systems to further strengthen internal controls.
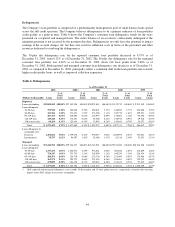
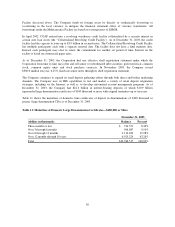
Non-interest expense for the year ended December 31, 2002, increased $527.6 million, or 13%, to $4.6 billion
from $4.1 billion for the year ended December 31, 2001. Contributing to the increase was salaries and associate
benefits, which increased $165.8 million, or 12%, to $1.6 billion in 2002, from an increase of $368.7 million, or
36%, to $1.4 billion in 2001. The decrease in the salaries and associate benefit growth rate as well as a decrease
in marketing expenses of $12.4 million compared to 2001, was the result of the Company’s efforts to slow loan
growth to more sustainable levels. All other non-interest expenses increased $374.1 million, or 24%, to $2.0
billion for the year ended December 31, 2002, from $1.6 billion in 2001. This increase was the result of a 23%
increase in the average number of accounts as compared to the prior year and $110.0 million of one-time charges
incurred in 2002. Of the $110.0 million: $38.8 million related to unused facility capacity, early termination of
facility leases, and the accelerated depreciation of fixed assets; $14.5 million related to the accelerated vesting of
restricted stock issued in connection with the PeopleFirst, Inc. (“PeopleFirst”) acquisition; and $12.5 million
related to the realignment of certain aspects of its European operations. The remaining amounts related to
investment company valuation adjustments, increases in associate related costs and accruals for contingent
liabilities.
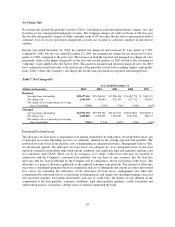
Income Taxes
The Company’s income tax rate was 37% for the year ended December 31, 2003 and 38% for the years ended
December 31, 2002 and 2001, respectively. The decrease was due to growth and improved results of the
Company’s International operations, which have lower effective tax rates. The effective rate includes both state
and federal income tax components.
40