Capital One 2003 Annual Report Download - page 62
Download and view the complete annual report
Please find page 62 of the 2003 Capital One annual report below. You can navigate through the pages in the report by either clicking on the pages listed below, or by using the keyword search tool below to find specific information within the annual report.-
 1
1 -
2
-
3
-
4
-
5
-
6
-
7
-
8
-
9
-
10
-
11
-
12
-
13
-
14
-
15
-
16
-
17
-
18
-
19
-
20
-
21
-
22
-
23
-
24
-
25
-
26
-
27
-
28
-
29
-
30
-
31
-
32
-
33
-
34
-
35
-
36
-
37
-
38
-
39
-
40
-
41
-
42
-
43
-
44
-
45
-
46
-
47
-
48
-
49
-
50
-
51
-
 52
52 -
 53
53 -
 54
54 -
 55
55 -
 56
56 -
 57
57 -
 58
58 -
 59
59 -
 60
60 -
 61
61 -
 62
62 -
 63
63 -
 64
64 -
 65
65 -
 66
66 -
 67
67 -
 68
68 -
 69
69 -
 70
70 -
 71
71 -
 72
72 -
73
-
74
-
75
-
76
-
77
-
78
-
79
-
80
-
81
-
82
-
83
-
84
-
85
-
86
-
87
-
88
-
89
-
90
-
91
-
92
-
93
-
94
-
95
-
96
-
97
-
98
-
99
-
100
-
101
-
102
-
103
-
104
-
105
-
106
-
107
-
108
-
109
-
110
-
111
-
112
-
113
-
114
-
115
-
116
-
117
-
118
-
119
-
120
-
121
-
122
-
123
-
124
-
125
-
126
-
127
-
128
-
129
-
130
-
131
-
132
-
133
-
134
-
135
-
136
 |
 |

Delinquencies
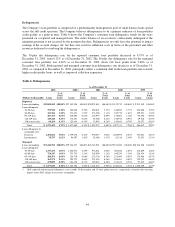
The Company’s loan portfolio is comprised of a predominantly homogeneous pool of small balance loans spread
across the full credit spectrum. The Company believes delinquencies to be a primary indicator of loan portfolio
credit quality at a point in time. Table 6 shows the Company’s consumer loan delinquency trends for the years
presented on a reported and managed basis. The entire balance of an account is contractually delinquent if the
minimum payment is not received by the payment due date. Delinquencies not only have the potential to impact
earnings if the account charges off, but they also result in additional costs in terms of the personnel and other
resources dedicated to resolving the delinquencies.
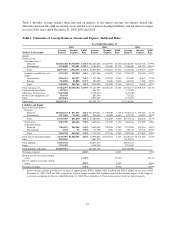
The 30-plus day delinquency rate for the reported consumer loan portfolio decreased to 4.79% as of
December 31, 2003, from 6.12% as of December 31, 2002. The 30-plus day delinquency rate for the managed
consumer loan portfolio was 4.46% as of December 31, 2003, down 114 basis points from 5.60% as of
December 31, 2002. Both reported and managed consumer loan delinquency rate decreases as of December 31,
2003, as compared to December 31, 2002, principally reflect a continued shift in the loan portfolio mix towards
higher credit quality loans, as well as, improved collection experience.
Table 6: Delinquencies
As of December 31
2003 2002(1) 2001 2000 1999
(Dollars in thousands) Loans
%of
Total
Loans Loans
%of
Total
Loans Loans
%of
Total
Loans Loans
%of
Total
Loans Loans
%of
Total
Loans
Reported:
Loans outstanding $32,850,269 100.00% $27,343,930 100.00% $20,921,014 100.00% $15,112,712 100.00% $ 9,913,549 100.00%
Loans delinquent:
30-59 days 755,930 2.30% 762,040 2.79% 494,871 2.37% 418,967 2.77% 236,868 2.39%
60-89 days 362,766 1.10% 373,451 1.37% 233,206 1.11% 242,770 1.61% 129,251 1.30%
90-119 days 207,353 0.63% 238,091 0.87% 144,957 0.69% 178,001 1.18% 94,550 0.95%
120-149 days 149,246 0.45% 174,651 0.64% 85,580 0.41% 136,932 0.91% 69,706 0.70%
150 or more days 98,164 0.31% 125,636 0.45% 53,943 0.26% 120,641 0.79% 56,257 0.58%
Total $ 1,573,459 4.79% $ 1,673,869 6.12% $ 1,012,557 4.84% $ 1,097,311 7.26% $ 586,632 5.92%
Loans delinquent by
geographic area:
Domestic 1,494,662 5.01% 1,579,272 6.42% 930,077 5.02% 1,034,995 8.23% 533,081 6.85%
International 78,797 2.62% 94,597 3.42% 82,480 3.47% 62,316 2.46% 53,551 2.51%
Managed:
Loans outstanding $71,244,796 100.00% $59,746,537 100.00% $45,263,963 100.00% $29,524,026 100.00% $20,236,588 100.00%
Loans delinquent:
30-59 days 1,335,231 1.87% 1,366,072 2.29% 934,681 2.06% 605,040 2.05% 416,829 2.06%
60-89 days 718,247 1.01% 753,735 1.26% 502,959 1.11% 349,250 1.18% 238,476 1.18%
90-119 days 488,471 0.69% 526,710 0.88% 353,750 0.78% 251,690 0.85% 176,986 0.87%
120-149 days 365,971 0.51% 394,721 0.66% 251,434 0.56% 184,061 0.62% 129,255 0.64%
150 or more days 270,009 0.38% 304,156 0.51% 198,823 0.44% 154,613 0.53% 97,223 0.48%
Total $ 3,177,929 4.46% $ 3,345,394 5.60% $ 2,241,647 4.95% $ 1,544,654 5.23% $ 1,058,769 5.23%
(1) 2002 reported and managed delinquency rates include 28 basis point and 13 basis point increases, respectively, related to the one-time
impact of the 2002 change in recoveries assumption.
44