Capital One 2003 Annual Report Download - page 53
Download and view the complete annual report
Please find page 53 of the 2003 Capital One annual report below. You can navigate through the pages in the report by either clicking on the pages listed below, or by using the keyword search tool below to find specific information within the annual report.-
 1
1 -
2
-
3
-
4
-
5
-
6
-
7
-
8
-
9
-
10
-
11
-
12
-
13
-
14
-
15
-
16
-
17
-
18
-
19
-
20
-
21
-
22
-
23
-
24
-
25
-
26
-
27
-
28
-
29
-
30
-
31
-
32
-
33
-
34
-
35
-
36
-
37
-
38
-
39
-
40
-
41
-
42
-
 43
43 -
 44
44 -
 45
45 -
 46
46 -
 47
47 -
 48
48 -
 49
49 -
 50
50 -
 51
51 -
 52
52 -
 53
53 -
 54
54 -
 55
55 -
 56
56 -
 57
57 -
 58
58 -
 59
59 -
 60
60 -
 61
61 -
 62
62 -
 63
63 -
64
-
65
-
66
-
67
-
68
-
69
-
70
-
71
-
72
-
73
-
74
-
75
-
76
-
77
-
78
-
79
-
80
-
81
-
82
-
83
-
84
-
85
-
86
-
87
-
88
-
89
-
90
-
91
-
92
-
93
-
94
-
95
-
96
-
97
-
98
-
99
-
100
-
101
-
102
-
103
-
104
-
105
-
106
-
107
-
108
-
109
-
110
-
111
-
112
-
113
-
114
-
115
-
116
-
117
-
118
-
119
-
120
-
121
-
122
-
123
-
124
-
125
-
126
-
127
-
128
-
129
-
130
-
131
-
132
-
133
-
134
-
135
-
136
 |
 |
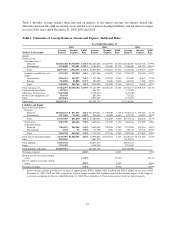
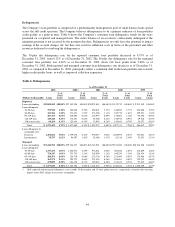
for the reported loan portfolio at December 31, 2003. The decrease in delinquency and forecasted charge-off
rates reflects a change in the mix of the reported loan portfolio towards a higher concentration of higher credit
quality loans; as a result the allowance to reported loans decreased to 4.86% at December 31, 2003 from 6.29%
at December 31, 2002.
For the year ended December 31, 2003, after-tax gains on sales of auto loans increased $24.4 million to $41.9
million from $17.5 million for the year ended December 31, 2002. The Company continued to enter into whole
loan auto sale transactions during 2003 in accordance with its corporate funding plan.
During 2003, the Company realized after-tax losses on the sales of securities totaling $5.9 million, compared to
$48.1 million of after-tax gains on sales of securities recognized in 2002. In addition, there were no gains on the
repurchase of senior bank notes recognized during 2003, compared to after-tax gains of $16.7 million recognized
in 2002. The Company routinely evaluates its liquidity portfolio positions and rebalances its investment portfolio
when appropriate, which results in periodic gains and losses.
Marketing expense increased $47.8 million to $1.1 billion for the year ended December 31, 2003, compared to
the same period in the prior year. The increase in marketing expense resulted from favorable opportunities to
originate higher credit quality loans during 2003 combined with continued branding efforts. Operating expenses
increased $223.3 million for the year ended December 31, 2003 to $3.7 billion from $3.5 billion for the same
period in the prior year. The increases were primarily due to increased credit and recovery efforts, investment in
IT infrastructure to support future growth and costs associated with the expansion of the Company’s enterprise
risk management program and systems to further strengthen internal controls.
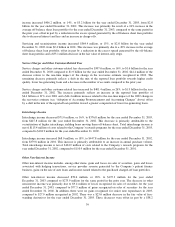
Year Ended December 31, 2002 Compared to Year Ended December 31, 2001
Net income increased to $899.6 million, or $3.93 per share, for the year ended December 31, 2002, compared to
net income of $642.0 million, or $2.91 per share, in 2001. This represents 40% net income growth and 35%
earnings per share growth in 2002. The growth in earnings for 2002 was primarily attributable to the growth in
the Company’s managed loan portfolio, combined with gains on sale of securities and the repurchase of senior
notes, offset by a reduction in the managed net interest margin, significant increases in the provision for loan
losses, write-downs of interest-only strips, certain one-time charges, and the impact of the change in recoveries
classification.
The Company has retained servicing rights for its securitized loans and receives servicing fees in addition to the
excess spread generated from the securitized loan portfolio. Average managed loans increased 48% to $52.8
billion for 2002 from $35.6 billion for 2001. Total managed loans increased 32% to $59.7 billion at
December 31, 2002 from $45.3 billion at December 31, 2001.
During 2002, the Company realized after-tax gains on the sale of securities totaling $48.1 million, compared with
similar after tax gains in 2001 of $8.4 million. In addition, during 2002 the Company realized after-tax gains on
the repurchase of senior notes of $16.7 million.
The managed net interest margin for the year ended December 31, 2002, decreased to 9.23% from 9.40% for the
year ended December 31, 2001. This decrease was primarily the result of a 124 basis point decrease in consumer
loan yield to 14.64% for 2002, from 15.88% in 2001, largely offset by a decrease in the cost of funds. This
decline in yield was due to a shift in the mix of the managed portfolio to lower yielding, higher credit quality
loans, an increase in low introductory rate accounts as compared to the prior year and reduced pricing on many of
the Company’s new loans in response to lower funding costs and increased competitive pressure.
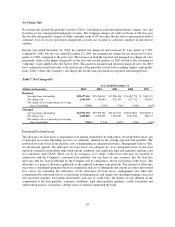
During 2002, the provision for loan losses increased by $1.0 billion over 2001. The ratio of allowance for loan
losses to reported loans increased to 6.29% at December 31, 2002, compared to 4.02% at December 31, 2001.
The increase in the provision for loan losses and corresponding build in the allowance for loan losses reflects an
35