Capital One 2003 Annual Report Download - page 91
Download and view the complete annual report
Please find page 91 of the 2003 Capital One annual report below. You can navigate through the pages in the report by either clicking on the pages listed below, or by using the keyword search tool below to find specific information within the annual report.-
 1
1 -
2
-
3
-
4
-
5
-
6
-
7
-
8
-
9
-
10
-
11
-
12
-
13
-
14
-
15
-
16
-
17
-
18
-
19
-
20
-
21
-
22
-
23
-
24
-
25
-
26
-
27
-
28
-
29
-
30
-
31
-
32
-
33
-
34
-
35
-
36
-
37
-
38
-
39
-
40
-
41
-
42
-
43
-
44
-
45
-
46
-
47
-
48
-
49
-
50
-
51
-
52
-
53
-
54
-
55
-
56
-
57
-
58
-
59
-
60
-
61
-
62
-
63
-
64
-
65
-
66
-
67
-
68
-
69
-
70
-
71
-
72
-
73
-
74
-
75
-
76
-
77
-
78
-
79
-
80
-
 81
81 -
 82
82 -
 83
83 -
 84
84 -
 85
85 -
 86
86 -
 87
87 -
 88
88 -
 89
89 -
 90
90 -
 91
91 -
 92
92 -
 93
93 -
 94
94 -
 95
95 -
 96
96 -
 97
97 -
 98
98 -
 99
99 -
 100
100 -
 101
101 -
102
-
103
-
104
-
105
-
106
-
107
-
108
-
109
-
110
-
111
-
112
-
113
-
114
-
115
-
116
-
117
-
118
-
119
-
120
-
121
-
122
-
123
-
124
-
125
-
126
-
127
-
128
-
129
-
130
-
131
-
132
-
133
-
134
-
135
-
136
 |
 |

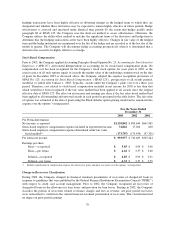
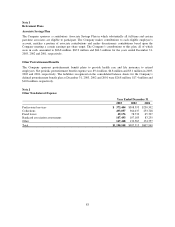
During the third quarter 2002, the Company expensed $38.8 million ($24.1 million after taxes) related to early
termination of leases, unused facility capacity, and accelerated depreciation of related fixed assets. The Company
allocated $32.8 million of these expenses to the U.S. Card segment, $1.6 million to the Other category, $1.1
million to the Auto Finance segment and $3.3 million to the Global Financial Services segment.
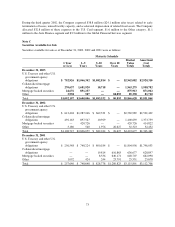
Note C
Securities Available for Sale
Securities available for sale as of December 31, 2003, 2002 and 2001 were as follows:
Maturity Schedule
1Year
or Less
1–5
Years
5–10
Years
Over 10
Years
Market
Value
Totals
Amortized
Cost
Totals
December 31, 2003
U.S. Treasury and other U.S.
government agency
obligations $ 792,926 $1,066,342 $1,082,814 $ — $2,942,082 $2,920,310
Collateralized mortgage
obligations 270,637 1,681,920 10,718 — 1,963,275 1,958,782
Mortgage backed securities 24,676 851,237 — — 875,913 871,062
Other 3,958 507 — 80,893 85,358 81,710
Total $1,092,197 $3,600,006 $1,093,532 $ 80,893 $5,866,628 $5,831,864
December 31, 2002
U.S. Treasury and other U.S.
government agency
obligations $ 613,404 $1,287,246 $ 669,339 $ — $2,569,989 $2,522,429
Collateralized mortgage
obligations 492,163 897,547 10,929 — 1,400,639 1,373,759
Mortgage backed securities — 420,726 — — 420,726 414,822
Other 3,180 540 1,976 26,627 32,323 32,452
Total $1,108,747 $2,606,059 $ 682,244 $ 26,627 $4,423,677 $4,343,462
December 31, 2001
U.S. Treasury and other U.S.
government agency
obligations $ 256,548 $ 748,224 $ 800,184 $ — $1,804,956 $1,796,033
Collateralized mortgage
obligations — — 19,814 616,863 636,677 628,897
Mortgage backed securities — — 8,536 640,171 648,707 662,098
Other 1,092 424 244 23,791 25,551 25,678
Total $ 257,640 $ 748,648 $ 828,778 $1,280,825 $3,115,891 $3,112,706
73