Capital One 2003 Annual Report Download - page 116
Download and view the complete annual report
Please find page 116 of the 2003 Capital One annual report below. You can navigate through the pages in the report by either clicking on the pages listed below, or by using the keyword search tool below to find specific information within the annual report.-
 1
1 -
2
-
3
-
4
-
5
-
6
-
7
-
8
-
9
-
10
-
11
-
12
-
13
-
14
-
15
-
16
-
17
-
18
-
19
-
20
-
21
-
22
-
23
-
24
-
25
-
26
-
27
-
28
-
29
-
30
-
31
-
32
-
33
-
34
-
35
-
36
-
37
-
38
-
39
-
40
-
41
-
42
-
43
-
44
-
45
-
46
-
47
-
48
-
49
-
50
-
51
-
52
-
53
-
54
-
55
-
56
-
57
-
58
-
59
-
60
-
61
-
62
-
63
-
64
-
65
-
66
-
67
-
68
-
69
-
70
-
71
-
72
-
73
-
74
-
75
-
76
-
77
-
78
-
79
-
80
-
81
-
82
-
83
-
84
-
85
-
86
-
87
-
88
-
89
-
90
-
91
-
92
-
93
-
94
-
95
-
96
-
97
-
98
-
99
-
100
-
101
-
102
-
103
-
104
-
105
-
 106
106 -
 107
107 -
 108
108 -
 109
109 -
 110
110 -
 111
111 -
 112
112 -
 113
113 -
 114
114 -
 115
115 -
 116
116 -
 117
117 -
 118
118 -
 119
119 -
 120
120 -
 121
121 -
 122
122 -
 123
123 -
 124
124 -
 125
125 -
 126
126 -
127
-
128
-
129
-
130
-
131
-
132
-
133
-
134
-
135
-
136
 |
 |

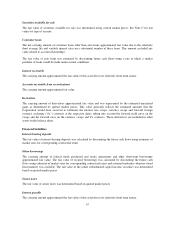
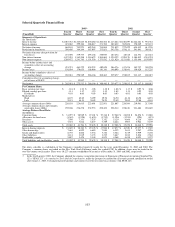
Derivatives
The carrying amount of derivatives approximated fair value and was represented by the estimated unrealized
losses as determined by quoted market prices. This value generally reflects the estimated amounts that the
Corporation would have paid to terminate the interest rate swaps, currency swaps and f/x contracts at the
respective dates, taking into account the forward yield curve on the swaps and the forward rates on the currency
swaps and f/x contracts. These derivatives are included in other liabilities on the balance sheet.
2003 2002
Carrying
Amount
Estimated
Fair Value
Carrying
Amount
Estimated
Fair Value
Financial Assets
Cash and cash equivalents $ 1,980,282 $ 1,980,282 $ 918,778 $ 918,778
Securities available for sale 5,866,628 5,866,628 4,423,677 4,423,677
Net loans 31,255,269 31,571,269 25,623,930 25,623,930
Interest receivable 214,295 214,295 217,512 217,512
Accounts receivable from securitizations 4,748,962 4,748,962 3,606,549 3,606,549
Derivatives 338,549 338,549 435,383 435,383
Financial Liabilities
Interest-bearing deposits $22,416,332 $23,138,228 $17,325,965 $18,260,362
Senior notes 7,016,020 7,423,326 5,565,615 5,432,411
Other borrowings 7,796,613 7,793,758 6,365,075 6,446,669
Interest payable 256,015 256,015 236,081 236,081
Derivatives 481,228 481,228 500,471 500,471
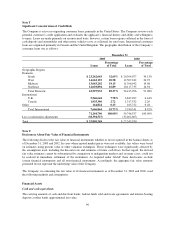
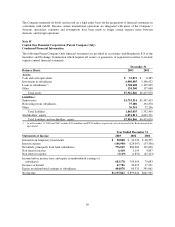
Note V
International Activities
The Company’s international activities are primarily performed through Capital One Bank (Europe) plc, a
subsidiary bank of the Bank that provides consumer lending and other financial products in Europe and Capital
One Bank—Canada Branch, a foreign branch office of the Bank that provides consumer lending products in
Canada. The total assets, revenue, income before income taxes and net income of the international operations are
summarized below.
2003 2002 2001
Domestic
Total Assets $42,230,859 $34,420,099 $25,254,438
Revenue(1) 7,461,825 7,604,075 5,738,433
Income before income taxes and cumulative accounting change 1,736,362 1,436,706 1,064,420
Net Income 1,090,296 899,429 660,809
International
Total Assets 4,052,847 2,962,281 2,929,609
Revenue(1) 739,188 581,873 475,471
Income before income taxes and cumulative accounting change 90,431 14,333 (29,000)
Net Income (loss) 45,546 215 (18,844)
Total Company
Total Assets $46,283,706 $37,382,380 $28,184,047
Revenue(1) 8,201,013 8,185,948 6,213,904
Income before income taxes and cumulative accounting change 1,826,793 1,451,039 1,035,420
Net Income (loss) 1,135,842 899,644 641,965
(1) Revenue equals net interest income plus non-interest income.
98