Capital One 2003 Annual Report Download - page 90
Download and view the complete annual report
Please find page 90 of the 2003 Capital One annual report below. You can navigate through the pages in the report by either clicking on the pages listed below, or by using the keyword search tool below to find specific information within the annual report.-
 1
1 -
2
-
3
-
4
-
5
-
6
-
7
-
8
-
9
-
10
-
11
-
12
-
13
-
14
-
15
-
16
-
17
-
18
-
19
-
20
-
21
-
22
-
23
-
24
-
25
-
26
-
27
-
28
-
29
-
30
-
31
-
32
-
33
-
34
-
35
-
36
-
37
-
38
-
39
-
40
-
41
-
42
-
43
-
44
-
45
-
46
-
47
-
48
-
49
-
50
-
51
-
52
-
53
-
54
-
55
-
56
-
57
-
58
-
59
-
60
-
61
-
62
-
63
-
64
-
65
-
66
-
67
-
68
-
69
-
70
-
71
-
72
-
73
-
74
-
75
-
76
-
77
-
78
-
79
-
 80
80 -
 81
81 -
 82
82 -
 83
83 -
 84
84 -
 85
85 -
 86
86 -
 87
87 -
 88
88 -
 89
89 -
 90
90 -
 91
91 -
 92
92 -
 93
93 -
 94
94 -
 95
95 -
 96
96 -
 97
97 -
 98
98 -
 99
99 -
 100
100 -
101
-
102
-
103
-
104
-
105
-
106
-
107
-
108
-
109
-
110
-
111
-
112
-
113
-
114
-
115
-
116
-
117
-
118
-
119
-
120
-
121
-
122
-
123
-
124
-
125
-
126
-
127
-
128
-
129
-
130
-
131
-
132
-
133
-
134
-
135
-
136
 |
 |

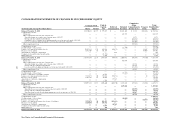
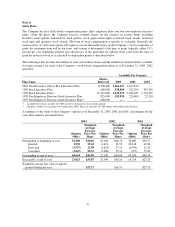
The Company maintains its books and records on a legal entity basis for the preparation of financial statements in
conformity with GAAP. The following tables present information prepared from the Company’s internal
management information system, which is maintained on a line of business level through allocations from legal
entities.
For the Year Ended December 31, 2003
U.S. Card
Auto
Finance
Global
Financial
Services Other
Total
Managed
Securitization
Adjustments
Total
Reported
Net interest income $ 4,287,814 $ 727,987 $ 1,072,098 $ (49,985) $ 6,037,914 $ (3,252,825)$ 2,785,089
Non-interest income 3,583,357 101,984 605,821 (90,536) 4,200,626 1,215,298 5,415,924
Provision for loan losses 2,647,406 382,952 595,543 (70,877) 3,555,024 (2,037,527) 1,517,497
Non-interest expenses 3,348,894 289,414 988,321 253,963 4,880,592 — 4,880,592
Income tax provision (benefit) 693,702 58,314 29,216 (114,150) 667,082 — 667,082
Net income (loss) $ 1,181,169 $ 99,291 $ 64,839 $(209,457)$ 1,135,842 $ — $ 1,135,842
Loans receivable $46,278,750 $8,466,873 $16,507,937 $ (8,764)$71,244,796 $(38,394,527)$32,850,269
For the Year Ended December 31, 2002
U.S. Card
Auto
Finance
Global
Financial
Services Other
Total
Managed
Securitization
Adjustments
Total
Reported
Net interest income $ 3,931,880 $ 544,501 $ 750,540 $ 57,417 $ 5,284,338 $ (2,565,226) $ 2,719,112
Non-interest income 3,874,987 65,509 504,438 (33,760) 4,411,174 1,055,662 5,466,836
Provision for loan losses 2,801,423 361,717 440,616 55,136 3,658,892 (1,509,564) 2,149,328
Non-interest expenses 3,391,283 231,741 827,376 135,181 4,585,581 — 4,585,581
Income tax provision (benefit) 613,381 6,290 (4,883) (63,393) 551,395 — 551,395
Net income (loss) $ 1,000,780 $ 10,262 $ (8,131) $(103,267)$ 899,644 $ — $ 899,644
Loans receivable $40,862,142 $6,992,541 $11,868,006 $ 23,848 $59,746,537 $(32,402,607) $27,343,930
For the Year Ended December 31, 2001
U.S. Card
Auto
Finance
Global
Financial
Services Other
Total
Managed
Securitization
Adjustments
Total
Reported
Net interest income $ 2,988,939 $ 215,838 $ 484,183 $ (55,143)$ 3,633,817 $ (1,883,675)$ 1,750,142
Non-interest income 3,008,536 19,879 324,396 60,966 3,413,777 1,049,985 4,463,762
Provision for loan losses 1,589,242 174,897 251,862 (61,854) 1,954,147 (833,690) 1,120,457
Non-interest expenses 3,159,370 117,853 632,980 147,824 4,058,027 — 4,058,027
Income tax provision (benefit) 474,568 (21,672) (31,618) (27,823) 393,455 — 393,455
Net income (loss) $ 774,295 $ (35,361)$ (44,645)$ (52,324) $ 641,965 $ — $ 641,965
Loans receivable $33,037,910 $3,957,729 $8,318,395 $ (50,071) $45,263,963 $(24,342,949)$20,921,014
The $15.0 million ($23.9 million pre-tax) charge for the cumulative effect of a change in accounting principle
related to the adoption of FIN 46 was included in non-interest expense and reported in the Other category for
segment reporting for the year ended December 31, 2003.
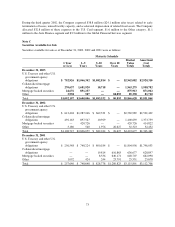
During the years ended December 31, 2003 and 2002, the Company sold $1.9 billion and $1.5 billion,
respectively, of auto loans. These transactions resulted in gains of $66.4 million and $28.2 million for the years
ended December 31, 2003 and 2002, respectively, of which $56.9 million and $24.6 million was allocated to the
Auto Finance segment while the remainder was held in the Other category.
During 2002, the Company realigned certain aspects of its European operations. Charges related to the
realignment of $12.5 million ($7.8 million after taxes) were recognized and allocated to the Global Financial
Services segment.
72