Capital One 2003 Annual Report Download - page 82
Download and view the complete annual report
Please find page 82 of the 2003 Capital One annual report below. You can navigate through the pages in the report by either clicking on the pages listed below, or by using the keyword search tool below to find specific information within the annual report.-
 1
1 -
2
-
3
-
4
-
5
-
6
-
7
-
8
-
9
-
10
-
11
-
12
-
13
-
14
-
15
-
16
-
17
-
18
-
19
-
20
-
21
-
22
-
23
-
24
-
25
-
26
-
27
-
28
-
29
-
30
-
31
-
32
-
33
-
34
-
35
-
36
-
37
-
38
-
39
-
40
-
41
-
42
-
43
-
44
-
45
-
46
-
47
-
48
-
49
-
50
-
51
-
52
-
53
-
54
-
55
-
56
-
57
-
58
-
59
-
60
-
61
-
62
-
63
-
64
-
65
-
66
-
67
-
68
-
69
-
70
-
71
-
 72
72 -
 73
73 -
 74
74 -
 75
75 -
 76
76 -
 77
77 -
 78
78 -
 79
79 -
 80
80 -
 81
81 -
 82
82 -
 83
83 -
 84
84 -
 85
85 -
 86
86 -
 87
87 -
 88
88 -
 89
89 -
 90
90 -
 91
91 -
 92
92 -
93
-
94
-
95
-
96
-
97
-
98
-
99
-
100
-
101
-
102
-
103
-
104
-
105
-
106
-
107
-
108
-
109
-
110
-
111
-
112
-
113
-
114
-
115
-
116
-
117
-
118
-
119
-
120
-
121
-
122
-
123
-
124
-
125
-
126
-
127
-
128
-
129
-
130
-
131
-
132
-
133
-
134
-
135
-
136
 |
 |

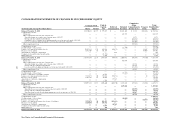
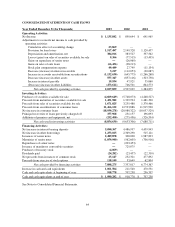
CONSOLIDATED STATEMENTS OF CASH FLOWS
Year Ended December 31 (In Thousands) 2003 2002 2001
Operating Activities:
Net Income $ 1,135,842 $ 899,644 $ 641,965
Adjustments to reconcile net income to cash provided by
operating activities:
Cumulative effect of accounting change 23,869 ——
Provision for loan losses 1,517,497 2,149,328 1,120,457
Depreciation and amortization, net 384,016 383,527 337,562
Losses (gains) on sales of securities available for sale 9,366 (77,515) (13,495)
Gains on repurchase of senior notes —(26,969) —
Gains on sales of auto loans (66,436) (28,213) —
Stock plan compensation expense 49,449 27,749 (11,134)
Decrease (increase) in interest receivable 3,217 (112,053) (20,087)
Increase in accounts receivable from securitizations (1,132,630) (645,775) (1,266,268)
Decrease (increase) in other assets 557,347 (857,116) (323,758)
Increase in interest payable 19,934 47,921 55,060
(Decrease) increase in other liabilities (473,612) 746,501 864,573
Net cash provided by operating activities 2,027,859 2,507,029 1,384,875
Investing Activities:
Purchases of securities available for sale (4,609,649) (5,748,073) (4,268,527)
Proceeds from maturities of securities available for sale 1,451,582 1,329,994 1,481,390
Proceeds from sales of securities available for sale 1,671,025 3,255,488 1,370,466
Proceeds from securitizations of consumer loans 11,466,122 12,533,886 11,915,990
Net increase in consumer loans (18,939,278) (20,980,322) (18,057,529)
Principal recoveries of loans previously charged off 357,968 231,157 196,093
Additions of premises and equipment, net (252,400) (275,436) (326,594)
Net cash used in investing activities (8,854,630) (9,653,306) (7,688,711)
Financing Activities:
Net increase in interest-bearing deposits 5,090,367 4,486,997 4,459,943
Net increase in other borrowings 1,253,025 2,369,290 515,121
Issuances of senior notes 2,489,878 300,000 1,987,833
Maturities of senior notes (1,059,940) (562,605) (706,916)
Repurchases of senior notes —(203,453) —
Issuance of mandatory convertible securities —725,075 —
Purchases of treasury stock (4,069) ——
Dividends paid (24,282) (23,457) (22,310)
Net proceeds from issuances of common stock 25,147 232,321 477,892
Proceeds from exercise of stock options 118,149 33,649 62,804
Net cash provided by financing activities 7,888,275 7,357,817 6,774,367
Increase in cash and cash equivalents 1,061,504 211,540 470,531
Cash and cash equivalents at beginning of year 918,778 707,238 236,707
Cash and cash equivalents at end of year $ 1,980,282 $ 918,778 $ 707,238
See Notes to Consolidated Financial Statements.
64