Capital One 2003 Annual Report Download - page 61
Download and view the complete annual report
Please find page 61 of the 2003 Capital One annual report below. You can navigate through the pages in the report by either clicking on the pages listed below, or by using the keyword search tool below to find specific information within the annual report.-
 1
1 -
2
-
3
-
4
-
5
-
6
-
7
-
8
-
9
-
10
-
11
-
12
-
13
-
14
-
15
-
16
-
17
-
18
-
19
-
20
-
21
-
22
-
23
-
24
-
25
-
26
-
27
-
28
-
29
-
30
-
31
-
32
-
33
-
34
-
35
-
36
-
37
-
38
-
39
-
40
-
41
-
42
-
43
-
44
-
45
-
46
-
47
-
48
-
49
-
50
-
 51
51 -
 52
52 -
 53
53 -
 54
54 -
 55
55 -
 56
56 -
 57
57 -
 58
58 -
 59
59 -
 60
60 -
 61
61 -
 62
62 -
 63
63 -
 64
64 -
 65
65 -
 66
66 -
 67
67 -
 68
68 -
 69
69 -
 70
70 -
 71
71 -
72
-
73
-
74
-
75
-
76
-
77
-
78
-
79
-
80
-
81
-
82
-
83
-
84
-
85
-
86
-
87
-
88
-
89
-
90
-
91
-
92
-
93
-
94
-
95
-
96
-
97
-
98
-
99
-
100
-
101
-
102
-
103
-
104
-
105
-
106
-
107
-
108
-
109
-
110
-
111
-
112
-
113
-
114
-
115
-
116
-
117
-
118
-
119
-
120
-
121
-
122
-
123
-
124
-
125
-
126
-
127
-
128
-
129
-
130
-
131
-
132
-
133
-
134
-
135
-
136
 |
 |

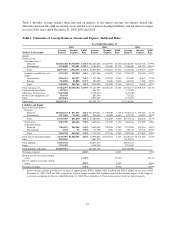
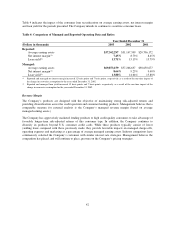
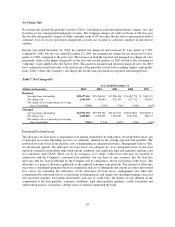
Table 5 provides income statement data and ratios for the Company’s reported and managed consumer loan
portfolio. The causes of increases and decreases in the various components of revenue are discussed in sections
previous to this analysis.
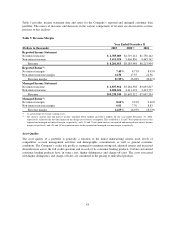
Table 5: Revenue Margin
Year Ended December 31
(Dollars in thousands) 2003 2002(2) 2001
Reported Income Statement
Net interest income $ 2,785,089 $2,719,112 $1,750,142
Non-interest income 5,415,924 5,466,836 4,463,762
Revenue $ 8,201,013 $8,185,948 $6,213,904
Reported Ratios(1):
Net interest margin 7.45% 8.73% 8.45%
Non-interest income margin 14.50 17.55 21.56
Revenue margin 21.95% 26.28% 30.01%
Managed Income Statement:
Net interest income $ 6,037,914 $5,284,338 $3,633,817
Non-interest income 4,200,626 4,411,174 3,413,777
Revenue $10,238,540 $9,695,512 $7,047,594
Managed Ratios(1):
Net interest margin 8.64% 9.23% 9.40%
Non-interest income margin 6.01 7.70 8.83
Revenue margin 14.65% 16.93% 18.23%
(1) As a percentage of average earning assets.
(2) Net interest income and non-interest income included $38.4 million and $44.4 million for the year-ended December 31, 2002,
respectively, related to the one-time impact of the change in recoveries assumption. This resulted in a 12 and 7 basis point increase in the
reported and managed net interest margin, respectively, and a 14 and 7 basis point increase in reported and managed non-interest income
margin, respectively, and a 26 and 14 basis point increase in the reported and managed revenue margin, respectively.
Asset Quality
The asset quality of a portfolio is generally a function of the initial underwriting criteria used, levels of
competition, account management activities and demographic concentration, as well as general economic
conditions. The Company’s credit risk profile is managed to maintain strong risk adjusted returns and increased
diversification across the full credit spectrum and in each of its consumer lending products. Certain customized
consumer lending products have, in some cases, higher delinquency and charge-off rates. The costs associated
with higher delinquency and charge-off rates are considered in the pricing of individual products.
43