Capital One 2003 Annual Report Download - page 55
Download and view the complete annual report
Please find page 55 of the 2003 Capital One annual report below. You can navigate through the pages in the report by either clicking on the pages listed below, or by using the keyword search tool below to find specific information within the annual report.-
 1
1 -
2
-
3
-
4
-
5
-
6
-
7
-
8
-
9
-
10
-
11
-
12
-
13
-
14
-
15
-
16
-
17
-
18
-
19
-
20
-
21
-
22
-
23
-
24
-
25
-
26
-
27
-
28
-
29
-
30
-
31
-
32
-
33
-
34
-
35
-
36
-
37
-
38
-
39
-
40
-
41
-
42
-
43
-
44
-
 45
45 -
 46
46 -
 47
47 -
 48
48 -
 49
49 -
 50
50 -
 51
51 -
 52
52 -
 53
53 -
 54
54 -
 55
55 -
 56
56 -
 57
57 -
 58
58 -
 59
59 -
 60
60 -
 61
61 -
 62
62 -
 63
63 -
 64
64 -
 65
65 -
66
-
67
-
68
-
69
-
70
-
71
-
72
-
73
-
74
-
75
-
76
-
77
-
78
-
79
-
80
-
81
-
82
-
83
-
84
-
85
-
86
-
87
-
88
-
89
-
90
-
91
-
92
-
93
-
94
-
95
-
96
-
97
-
98
-
99
-
100
-
101
-
102
-
103
-
104
-
105
-
106
-
107
-
108
-
109
-
110
-
111
-
112
-
113
-
114
-
115
-
116
-
117
-
118
-
119
-
120
-
121
-
122
-
123
-
124
-
125
-
126
-
127
-
128
-
129
-
130
-
131
-
132
-
133
-
134
-
135
-
136
 |
 |

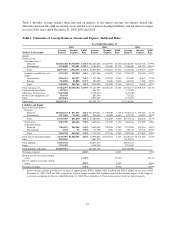
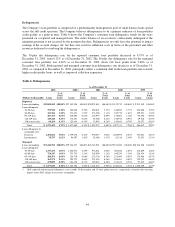
Table 1 provides average balance sheet data and an analysis of net interest income, net interest spread (the
difference between the yield on earning assets and the cost of interest-bearing liabilities) and net interest margin
for each of the years ended December 31, 2003, 2002 and 2001.
Table 1: Statements of Average Balances, Income and Expense, Yields and Rates
Year Ended December 31
2003 2002 2001
(Dollars in thousands)
Average
Balance
Income/
Expense
Yield/
Rate
Average
Balance
Income/
Expense
Yield/
Rate
Average
Balance
Income/
Expense
Yield/
Rate
Assets:
Earning assets
Consumer loans(1)
Domestic $25,923,208 $3,578,994 13.81%$22,248,006 $3,436,392 15.45% $14,648,298 $2,342,726 15.99%
International 2,754,408 353,301 12.83% 2,788,013 356,069 12.77% 2,636,008 386,793 14.67%
Total 28,677,616 3,932,295 13.71% 25,036,019 3,792,461 15.15% 17,284,306 2,729,519 15.79%
Securities available for sale 5,335,492 192,594 3.61% 3,873,186 184,407 4.76% 2,526,529 138,188 5.47%
Other
International 2,836,531 215,957 7.61% 1,951,996 187,230 9.59% 593,050 45,877 7.74%
Foreign 512,658 26,808 5.23% 286,398 16,668 5.82% 302,287 7,565 2.50%
Total 3,349,189 242,765 7.25% 2,238,394 203,898 9.11% 895,337 53,442 5.97%
Total earning assets 37,362,297 $4,367,654 11.69% 31,147,599 $4,180,766 13.42% 20,706,172 $2,921,149 14.11%
Cash and due from banks 387,167 507,355 171,392
Allowance for loan losses (1,627,020) (1,178,243) (637,789)
Premises and equipment, net 833,343 802,544 735,282
Other 4,239,626 2,922,469 2,371,252
Total assets $41,195,413 $34,201,724 $23,346,309
Liabilities and Equity:
Interest-bearing liabilities
Deposits
Domestic $18,550,273 $ 817,515 4.41%$14,650,582 $ 748,809 5.11% $ 9,700,132 $ 594,183 6.13%
International 1,217,690 74,135 6.09% 956,360 63,080 6.60% 673,379 46,287 6.87%
Total 19,767,963 891,650 4.51% 15,606,942 811,889 5.20% 10,373,511 640,470 6.17%
Senior notes 5,915,300 448,646 7.58% 5,668,343 422,529 7.45% 5,064,356 357,495 7.06%
Other borrowings
Domestic 7,061,192 242,246 3.43% 5,689,369 226,206 3.98% 2,551,996 145,316 5.69%
International 1,532 23 1.50% 23,350 1,030 4.41% 440,313 27,726 6.30%
Total 7,062,724 242,269 3.43% 5,712,719 227,236 3.98% 2,992,309 173,042 5.78%
Total interest-bearing liabilities 32,745,987 $1,582,565 4.83% 26,988,004 $1,461,654 5.42% 18,430,176 $1,171,007 6.35%
Other 3,125,956 3,065,570 2,134,951
Total liabilities 35,871,943 30,053,574 20,565,127
Equity 5,323,470 4,148,150 2,781,182
Total liabilities and equity $41,195,413 $34,201,724 $23,346,309
Net interest spread 6.86% 8.00% 7.76%
Interest income to average earning
assets 11.69% 13.42% 14.11%
Interest expense to average earning
assets 4.24% 4.69% 5.66%
Net interest margin 7.45% 8.73% 8.45%
(1) Interest income includes past-due fees on loans of approximately $799.3 million, $955.8 million and $769.5 million for the years ended
December 31, 2003, 2002 and 2001, respectively. Interest income includes $38.4 million related to the one-time impact of the change in
recoveries assumption for the year ended December 31, 2002. This resulted in a 12 basis point increase in the net interest margin.
37